Guest Commentary by Mark E. Smith and Donald A. Molde
The authors present a novel approach to help answer the question “Who really pays for wildlife in the U.S?” Their research revealed approximately 94% of total funding for wildlife conservation and management comes from the non-hunting public. A proper understanding and accurate public perception of this funding question is a necessary next step in furthering the current debate as to whether and how much influence the general public should have at the wildlife policy-making level, particularly within state wildlife agencies.
Abstract
The authors present a novel approach to help answer the question “Who really pays for wildlife in the U.S?” Using public information about budgets of various conservation, wildlife advocacy, and land management agencies and non-profit organizations, published studies and educated assumptions regarding sources of Pittman-Robertson Act and Dingle-Johnson Act federal excise monies from the sale of sporting equipment, the authors contend that approximately 95% of federal, 88% of non-profit, and 94% of total funding for wildlife conservation and management come from the non-hunting public. The authors further contend that a proper understanding and accurate public perception of this funding question is a necessary next step in furthering the current debate as to whether and how much influence the general public should have at the wildlife policy-making level, particularly within state wildlife agencies.
Introduction
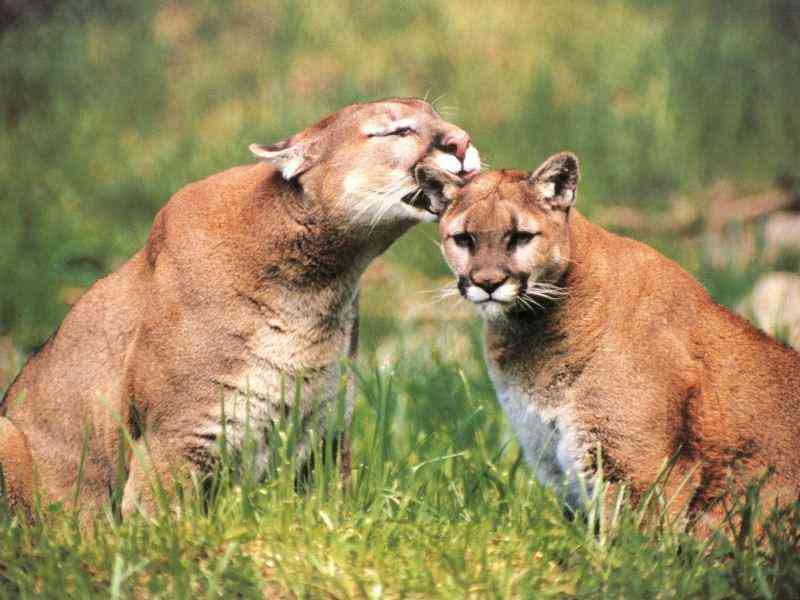
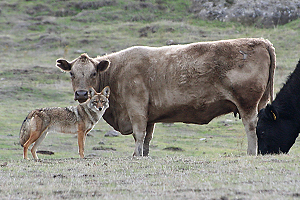
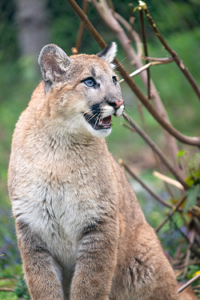
With increased awareness and interest of the general (non consumptive) public in controversial wildlife management issues such as fur trapping, predator control, trophy hunting, coyote killing contests and wolf reintroduction, a debate is before us as to whether the general public is or should be afforded a proper voice in wildlife management decisions. Sportsmen favor the current system, which places a heavy emphasis on their interests through favorable composition of wildlife commissions and a continued emphasis on ungulate management. Nonhuman predators (wolves, mountain lions, coyotes, ravens and others) are disfavored by wildlife managers at all levels as competition for sportsmen and are treated as second-class citizens of the animal kingdom. Sportsmen suggest this bias is justified because “Sportsmen pay for wildlife,” a refrain heard repeatedly when these matters are discussed. Agency personnel and policy foster this belief as well.
Do sportsmen really pay for wildlife? Is it a fact or an unfounded assertion or something in between? Are there ways of looking at financial and other information to test the merit of this claim? While wildlife is unequivocally a public asset under the Public Trust Doctrine (see, for example, SCOUS 1842 and Horner 2000), a better understand and definition of how wildlife management is financed in this country, particularly the portion attributable to the general public, would be of considerable help in deciding whether the general public’s interest is adequately represented in our current wildlife management system.
Summary of Findings
While this question is not easy to answer and the information may be murky, we have devised a novel approach, using available public information and certain helpful assumptions to offer a perspective on this question, which, to our knowledge, has not been previously presented.

The results are expressed both in terms of annual budgets by organization (Table 1) and acreages under management (Table 2). In summary, approximately 95% of federal, 88% of nonprofit, and 94% of total funding for wildlife conservation and management come from the non-hunting public.
This runs counter to the common position promoted by many hunter-centric organizations and even to what state wildlife agencies often cite (e.g. Mayer, 2012). Another example of this is a motto of the Rocky Mountain Elko Foundation: “Hunting is Conservation.”Obviously hunting per se is not conservation, but they claim that hunting funds conservation, nearly exclusively.
The data in Table 1 shows that the financial contribution from hunters is a small portion of the total. Of the 8 largest federally funded wildlife programs listed in the top half of Table 1, a total of $18.7 billion is spent annually on wildlife, land management and related programs (including hunter education). Approximately 5.3% of the combined operating budgets (top half of Table 1) and 4.9% of the land acquisition costs (Table 2) are funded by hunters or through hunting-related activities. The 10 largest non-profit conservation organizations contribute $2.5 billion annually to habitat and wildlife conservation; of this, 12.3% comes from hunters and 87.7% from the non-hunting public (bottom half of Table 1).
Methodology
In Tables 1 & 2 values have been assigned for the portion of funding derived from hunters or hunting-related activities. The difference between “hunter and “hunting related” as well as the allocation of Pittman-Robertson and Dingell-Johnston Act funds are discussed in the section entitled Pittman-Robertson & Dingell-Johnson Acts. The allocations for the other items are discussed in the sections entitled General Tax Revenue and Duck Stamp Act.
State funding was not considered in this study, in part because most state wildlife agency funding flows from the federal government (about 70% in Nevada’s case), and in part because it would be a task larger than our resources allowed.

It is also generally true that the state funding (e.g. hunter license and tag sales) is rarely adequate to cover the direct costs of administering the related programs; therefore, state-level funding can reasonably be classified as hunting or sportsmen services rather than wildlife management. State-owned public lands are considered in terms of the acreage under management in Table 2. Also not considered is the portion that each agency or organization actually spends on conservation versus other activities.
For example, most state wildlife agencies spent only a small portion of their total funding on conservation. Other organizations, such as the government funded National Wildlife Refuge System and the donor funded Nature Conservancy, spend the great majority of their funding on conservation. This differential was ignored in our analysis.
Table 1: Summary of Conservation Funding by Source
(M = million US dollars)
| Source | Total Annual Funding, $ |
Activities Funded by Hunters |
Activities Funded by Non-hunting Public, $ |
|
| % of Total |
$ | |||
| National Wildlife Refuge System (operating budget, see Table 2 for land purchase funding) | $276M | 4.6% | $13M | $263M |
| Pittman-Robertson & Dingell-Johnson Acts Funds:
Funding based on hunting activities Funding based on population |
$882M | 14.5%
4.6% |
$128M $35M |
$719M |
| USDA Wildlife Services | $89M | 4.6% | $4 | $85M |
| USDI Fish & Wildlife | $2,795M | 4.6% | $129M | $2,666M |
| US BLM | $1,200M | 4.6% | $56M | $1,144M |
| US Forest Service | $9,779M | 4.6% | $453M | $9,326M |
| National Park System | $3,650M | 4.6% | $169M | $3,481M |
| SUBTOTAL
Federal Funding |
$18,671M | 5.3% | $986M | $17,685M
94.7% |
| Nature Conservancy | $859M | 4.6% | $40M | $819M |
| Land Trusts (all, except N.C) | $535M | 4.6% | $25M | $510M |
| Wildlife Conservation Society | $230M | 4.6% | $11M | $219M |
| World Wildlife Fund | $204M | 4.6% | $9M | $195M |
| Ducks Unlimited | $147M | 99% | $146M | $1 M |
| The Conservation Fund | $138M | 4.6% | $6M | $132M |
| Natural Resources Defense Council | $123M | 4.6% | $6M | $117M |
| National Wildlife Federation | $93M | 4.6% | $4M | $89M |
| National Audubon Society | $89M | 4.6% | $4M | $85M |
| Rocky Mountain Elk Foundation | $54M | 99% | $53M | $1 M |
| SUBTOTAL
Non-profit Organizations |
$2,472M | 12.3% | $304M | $2,168M
87.7% |
| TOTAL
Federal & Non-profits |
$21,143M | 6.1% | $1,290M | $19,853M
93.9% |
In our analyses we included those agencies and organizations commonly considered by the public to have as their focus habitat and wildlife management or conservation (e.g. U.S. Department of the Interior Fish & Wildlife Service (FWS), National Wildlife Refuge System, Nature Conservancy, Audubon). We also included agencies and organizations whose primary purpose is to conserve or manage the lands that host wildlife (the U.S. Forest Service (USFS), U.S. Bureau of Land Management (US BLM), the state equivalents, the various land trusts).
The organizations that manage habitat, such as the US BLM and the many private land trusts, are included herein because wildlife requires habitat. The goals of these organizations include various combinations of habitat management and conservation, biological diversity (necessary to ensure robust populations), food and water supply, watershed protection, migration corridor management, and other issues critical to wildlife conservation and management.
A potentially controversial choice was to include the U.S. Department of Agriculture Wildlife Services. Their core function is to control native carnivores such as wolves, bears, and coyotes, ostensibly to protect agriculture and improve hunter opportunity (Bruskotter, 2011). Arguably they accomplish neither since most livestock mortality is due to weather, birthing, and disease, while most wildlife mortality is due to lack of food, impacts to habitat, and disease. While predator control is wildlife management it is not conservation. Nevertheless, we have included their budget in our funding analyses.
Table 2: Summary of Land Under Direct Management (M = million acres)
| Source | Land Under Management, acres |
Land Purchases Funded by Hunters |
Land
Purchases Funded by Non-hunting Public |
|
| ok | acres | acres | ||
| National Wildlife Refuge System | 150M | |||
| Funding based on hunting activities | 1.7% | 2.6M | ||
| Funding based on population | 4.6% | 6.8M | 140.6M | |
| US BLM | 248M | 4.6% | 9.9M | 236.5M |
| US Forest Service (note A) | 193M | 4.6% | 7.7M | 184.1M |
| National Park Service | 84M | 4.6% | 3.4M | 80.1M |
| State Lands (all states) | 197M | 4.6% | 7.9M | 187.9M |
| SUBTOTAL | 872M | 4.9% | 42.8M | 829.2M |
| State & Federal Funding | 95.1% | |||
| Nature Conservancy | 119M | 4.6% | 4.8M | 113.5M |
| Land Trusts (all) | 47M | 4.6% | 1.9M | 44.8M |
| SUBTOTAL | 166M | 4.6% | 7.7M | 158.3M |
| Non-profit Organizations | 95.4% | |||
| TOTALS | 1,038M | 4.9% | 50.5M | 987.5M |
| 95.1% | ||||
Note A. The USFS indirectly or cooperatively manages 600M acres.
Sources of Funding and Allocations
The sources of our funding and land acreage figures were, in most cases, the official websites for the named agencies or organizations. The total acreage under management by land trusts was obtained from the Land Trust Alliance (www.landtrustalliance.org). Pittman-Robertson Act and Dingell-Johnston Act revenue were obtained from the most recently published federal budgets for the Bureau of Alcohol, Tobacco, Firearms and Explosives (ATF) and US Fish and Wildlife Services (FWS), the agencies responsible for collecting and administering these funds, respectively. See the section entitled Pittman-Robertson and Dingell-Johnston Acts for a detailed discussion of how those revenues were allocated, as well as a brief discussion of the two Acts.
General Tax Revenue
Most of the federal programs relevant to wildlife management and conservation are funded from general tax revenue such as personal and corporate income taxes. The key exceptions to this are the tax transfers made to the states under three well known acts (and their amendments): the Federal Aid in Wildlife Restoration Act of 1937 (more commonly known as the Pittman-Robertson Act or PRA), the Federal Aid in Sport Fish Restoration Act (Dingell-Johnston Act or DJA), and the Migratory Bird Hunting Stamp Act (Duck Stamp Act). Each of these acts is discussed in more detail in subsequent sections.

Rather than attempt an allocation of general tax revenue funding to “hunter funding” and “non-hunting public funding” by some complex analysis of demographics, we chose the simpler, and possibly equally accurate, method of allocation based on the percent of the population who hunts. According to the US FWS (2013), there were 14,631,327 hunting licenses issued by all US states in 2013, down from 14,960,522 in 2012. There are two important bias in these statistics: hunters who purchased licenses in more than one state are counted for each state; and most states exempt youth from license requirements (e.g. Nevada hunters under the age of 12 years are not required to purchase a license, in some states the age is 16). We could not find any published analyses on either, so we have made no change to the data published by the FWS. It is likely that both figures are small and each acts to reduce the effect of the other.
According to the US Census Bureau (2013), the US population in July 2013 was 316,128,839. Dividing that into the number of hunting licenses sold in 2013 suggests that 4.6% of the population, and therefore the same percentage of general tax revenue is paid by hunters. That figure has been used in Tables 1 & 2. An important side note is that while the US population increases annually, the number of hunting licenses sold is on the decline.
Duck Stamp Act
Funding of wildlife land gets a lot of attention among sportsmen and other outdoor enthusiasts. One of the most common to come up in discussion is the Duck Stamp program and the land that it has successful protected as refuges under the National Wildlife Refuge System.
The federal government estimates that 1.9% of the 150,000,000 acres (or 2,850,000 acres) of land managed under this program was acquired with funds from programs including duck stamp sales (USFW, 2014; Lin, 2014).
It has been estimated that collectors purchase 10% of duck stamps. Duck stamps allow free access to refuges that otherwise charge an entrance fee, and an unknown portion of the public purchases them for this purpose. To determine the total hunter-sourced portion of the National Wildlife Refuge System acreage, we combined 90% of the 1.9% with the hunter portion of general tax revenue (4.6%).
Considering the four main federal agencies, the combined state-owned lands, and the collective non profits falling in the category of land trusts, there are 1.038 billion acres of wildlife habitat under conservation management, of which about 4.9% were funded by hunter and 95.1% funded by the non-hunting public.
Pittman-Robertson & Dingell-Johnson Acts
The process of determining the portion of the Pittman-Robertson Act (PRA) & Dingell-Johnson Act (DJA) excise taxes generated by hunting-related activities is both complex and imprecise. In the end, any such analysis can only be an estimate, since the revenue is not tracked in sufficient detail to allow a precise allocation. Our approach was to both recognize and minimize the biases created by our assumptions in these analyses. The approach taken in this study is briefly summarized here.
Beginning in 1919, there has been an excise tax on firearms and ammunition (10 to 11% of the wholesale price). This tax was originally administered under the US Treasury, and the income went into the general fund. In 1937, the Pittman-Robertson Act transferred this tax to administration by the FWS for the exclusive purposes of wildlife management, hunting management, and hunter education. The Dingell-Johnston Act (1950), as amended by the Wallop and Breaux Act (1984), extended the excise tax to archery equipment, fishing supplies, recreational boat import duties, and marine fuel sales. PRA and DJA funding totaled $522 million and $360 million, respectively, for the 2013 fiscal year.
Our analyses consider funding allocations in two portions: the first based on activity (hunting related versus non-hunting related), and the second on general population (hunters versus the non-hunting public). This section discusses the former; the latter uses the same allocation as for the other categories. We used this split approach for the PRA and DJA funds because firearms, ammunition, and archery equipment are purchased by both hunters and non-hunters and these are used for both hunting and non-hunting purposes. Therefore, putting the total revenue into either the “hunter” or “non-hunting public” categories would have created a strong bias.
The next step was to consider the nature of the purchases that generate the excise taxes collected. According to the ATF (Hogue, 2013), the PRA revenue is generated in the following proportions:

- 31% from handgun (pistols and revolvers) production
- 37% from long guns (rifles and shotguns) production
- 31% from ammunition production
- 1% from archery equipment production
Dingell-Johnston Act revenue is generated in the following proportions, according to US DF&W statistics (Michigan):
- 54% from motorboat fuel
- 15% from small engine fuel
- 16% from fishing equipment, tackle, trolling motors
- 9% from interest on trust fund deposits
- 6% from import duties on boats
Of these funds, we next made an estimate of the portion of the revenue generated from hunting. We used a variety of sources of information to produce these estimates, principally the following.
From ATF statistics on sales of firearms by type (ATF, 2011), we identified those types of firearms that are used principally for hunting. We used the following allocations: traditional rifles and shotgun sales were allocated to hunting; modern sporting rifles (including tactical shotguns) were allocated principally (but not exclusively) to non-hunting. The results was a combined allocation of 40% of long guns to hunting. Handgun sales were allocated 5% to hunting based on anecdotal evidence.
Statistics for ammunition sales published by industry sources (LuckyGunner, 2012 & 2013; Bushmann, 2014) were used to determine the approximate percentage of sales by caliber. Each caliber was then assigned to one of three categories: principally hunting, principally non-hunting, or split. Examples of ammunition classified herein as principally for hunting include .243 Winchester, .30-06 Springfield and .308 Winchester (traditional deer and elk calibers). Principally non-hunting ammunition include .380 acp, 9 mm parabellum (aka 9mm Luger), .45 acp, .338 Lapua and .50 BMG. Calibers considered to be used for both hunting and non-hunting include shotgun shells in all gauges, .223 Remington, 5.56x45mm, 7.62x39mm, and large bore magnum handgun calibers such as .44 Remington Magnum and .500 S&W Magnum. Based on the relative sales statistics, considerably less than 20% of ammunition sales appear to be hunting related, but 20% was used in our analysis; this higher figure was used because 2013 represented an anomaly in sales statistics, with sales more heavily weighted towards self-defense and tactical than a multi-year average would suggest.
Of the DJA revenue, the only category related to hunting is small engine fuel sales, some of which is likely used for waterfowl hunting. Our research did not find any data on allocation of these sales; we assumed 15% is derived from hunting-related activities.
Table 3 summarizes the allocations and presents the estimated total funding generated by hunting-related activities. The estimate of 14.5% is consistent with the results published by other authors, a commonly cited range being 14% to 22% of the DJA funds alone (Lin, 2014), which equates to 8% to 13% of the combined PRA and DJA funds.
Table 3: Allocation of Excise Tax Revenue Based on Activity
(M = million US dollars)
| Excise Tax Source | Total Tax Revenue, $ |
Proportion Derived from Hunting Activities |
|
| ova | $ | ||
| Handguns (revolvers, pistols) | 164M | 5 | 8M |
| Long guns (rifles, shotguns, MSRs) | 194M | 40 | 78M |
| Ammunition (all calibers) | 163M | 20 | 33M |
| Archery equipment and supplies | 4M | 33 | 1M |
| Fuel, motor boats | 194M | 0 | 0 |
| Fuel, small engine | 54M | 15 | 8M |
| Fishing equipment | 59M | 0 | 0 |
| Interest on reserves | 32M | 0 | 0 |
| Import duties on boats | 22M | 0 | 0 |
| TOTALS | $882M | 14.5% | $128M |
Another way to estimate the portion of PRA funds generated by hunting activity is to compare the number of guns used for hunting with total gun ownership. There are an estimated 270 to 310 million firearms in America (Krouse, 2012; GunPolicy; Crime Prevention Research Center, 2014). There are 14.6 million licensed hunters (FWS, 2013), though the number of licensed hunters who actually hunt is unknown. If we make an assumption that the average hunter owns 3 guns for hunting (e.g. two rifles and a shotgun), then 43.8 million guns are used for hunting, or 14.1 to 16.2% of the total. This would suggest that 8.8 to 10.1% of the combined PRA and DJA funds are hunting-sourced. If we increase the per-hunter ownership assumption to 5 guns, the portion of combined funding increase to 14.8 to 16.9%. Both ranges compare well with the 14.5% figure cited in Table 3.
Possible Biases In Our Analyses of PRA & DJA Revenue
A large portion of the PRA funds are set aside by law for hunter-specific uses rather than conservation or wildlife management. For example one half of the taxes generated from handguns and archery equipment are set aside exclusively for hunter education, which is principally about firearms safety (i.e., Hunter Ed); this totaled 15.9% of the PRA revenue in fiscal 2013. While one may reasonably argue that this money is not wildlife conservation funding, we have elected to ignore this issue. This creates a small bias in favor of the hunter-funding category.
Modern Sporting Rifles (MSRs) is an industry term for the class of rifles sometimes referred to assault rifles, assault weapons or tactical rifles. For the purposes of this paper the term is used for the class of rifles that include AR-10, AR-15, AK-47 and Uzi-style platforms and their variants. While many in the public and media seem to focus on the appearance, the most important features in terms of our use of this classification are the semi-automatic action, carbine length, and the use of a detachable magazine.
Fiscal 2013 was a record-setting year for firearm and ammunition sales, based on worries in the gun community about new federal gun control legislation following the Sandy Hook shootings and the reelection of President Obama. This increased the PRA funding, both in terms of the total dollars and the PRA percentage of the combined PRA and DJA revenues. This, in turn, increased the apparent hunting allocation over a multi-year average. At the same time the types of guns and ammunition which saw the greatest sales increases in 2013 were not traditional hunting equipment but rather modern sporting riflesaor MSRs), tactical shotguns, tactical and self defense ammunition. For example, 9mm handgun ammunition sales increased to 21.4% of the total in 2013 from 14.2% in 2012 (LuckyGunner, 2012 & 2013). According to the National Shooting Sports Foundation survey, “82% of recent purchases were AR-platform rifles” (NSSF, 2013). The disproportionate increase in sales of pistols, tactical long guns, and the related ammunition decreased the apparent hunting contribution. The net affect was not estimated.
We applied 40% of long gun sales in 2013 to hunting sales, though the statistics suggest that this number should be lower. If, for example, the above NSSF quote is accurate and 82% of recent sales were AR platforms, and if AR platforms are principally not used for hunting as other surveys and anecdotal evidence suggest, the actual percentage allocated to hunting could be overstated by 10 percentage points or more.
Closing Comments
Gill (1996) concluded that the narrowly based funding of state wildlife agencies has “blurred the essential distinction between public interest and special interest and inevitably eroded both scientific credibility and public trust.” We would argue that it is the perception not the reality that has blurred the distinction.
For example, then director of the Nevada Department of Wildlife Ken Mayer wrote to the legislative sunset subcommittee “…the contribution to NDOW’s operating budgets from sportsmen is 79 percent of total funding” (Mayer, 2012). He was assuming that all of the federal excise tax transfers were hunter-sourced. This is a misrepresentation often used to manipulate public opinion and influence policy.
This narrative “…logically encourages those who pay via licenses and permits for the privilege of using wildlife to expect greater benefits…Because [it’s believed that] hunters pay the bills, it is not surprising that they are given much attention and wield a great deal of influence…” (Jacobson et al, 2010).
Modern wildlife management has wandered far from the original path of the Public Trust Doctrine and the North American Wildlife Conservation Model from which it flows (SCOUS, 1842; Horner, 2000). Smith (1980) identified three criteria that need to be met for the Public Trust Doctrine to be effective:
- The general public must be aware of their legal standing with respect to public ownership of wildlife;
- This standing and the rights associated with it must be enforceable against the government so that the public can hold it accountable; and,
- Interpretation of these rights must be adaptable to contemporary concerns, such as biodiversity and species extinction.
All three are impaired when the basis of public debate is a myth. It’s time that we call for honest dialog from our state and federal agencies and transparency in wildlife policy making.
Acknowledgements
We would like to express our deepest gratitude to the many professionals who provided review, editing and critical input into the development of this paper. Especially noteworthy are Wendy Keefover of the Humane Society of the United States and Harley Shaw, retired, Arizona Game & Fish Department who provided invaluable review and editing support.
References
Bruskotter, Jeremy T. (2011), “Rescuing wolves from politics: wildlife as a public trust resource.” Science magazine, Vol. 333, pg. 1818-1829, September 30.
Bureau of Alcohol, Tobacco, Firearms and Explosives (2011), “Annual firearms manufacturers and export report.”
Bushmann, Ron (2014), “New Business Year 2014.” Shooting Industry magazine, January.
Crime Prevention Research Center (2014), “Comparing murder rates and gun ownership across countries.” March 31. http://crimepreventionresearchcenter.org/2014/03/comparing-murder-ratesacross-countries/
GunPolicy.org, “Number of privately owned firearms.” http://www.gunpolicy.org/firearms/region/united-states
Hogue, Thomas K. (2013), personal communication with Congressional Research Service as reported in “Guns, excise taxes, and wildlife restoration.” March 12.
Horner, S. M. (2000), “Embryo, not fossil: breathing life into the public trust in wildlife.” University of Wyoming College of Law, Land and Water Law Review 35:1-66.
Hunter Ed, http://www.hunter-ed.com/nevada/studyGuide/201034
Jacobson, Cynthia A., Organ, John F., Decker, Daniel J., Batcheller, Gordon R. and Carpenter, Len (2010), “A conservation institution for the 21st century: implications for state wildlife agencies.” Journal of Wildlife Management 74(2), pgs. 203-209, DOI: 10.2193/2008-485.
Krouse, William J. (2012), “Gun Control Legislation.” Congressional Research Service, November 14.
Lin, Doris (2014), “Do hunters pay for wildlife conservation?” http://animalrights.about.com/od/wildlife/f/Do-Hunters-Pay-For-WildlifeConservation.htm
LuckyGunner (2013), retail sales statistics. http://www.luckygunner.com/labs/2013-ammo-stats/
LuckyGunner (2012), retail sales statistics. http://www.luckygunner.com/labs/2012-ammo-stats/
Mayer, Kenneth (2012), former director of the Nevada Department of Wildlife, in a letter to Assemblywoman Irene Bustamante Adams, Chair, Sunset Subcommittee of the Legislative Commission, Nevada State Legislature, May 24.
Michigan Government official website, “Facts about conservation and Dingell-Johnson funding.” https://www.michigan.gov/documents/dnr/DingellJohnson Fact Sheet 398759 7.pdf
National Shooting Sports Foundation (NSSF, 2013), “NSSF Report modern sporting rifle (MSF) comprehensive consumer report 2013.” https://www.nsf.org
Smith, F.E. (1980), “The public trust doctrine, instream flows and resources.” California Water Policy Center and U.S. Fish & Wildlife Service, Newton Corner, Massachusetts.
Supreme Court of the United States, SCOUS (1842), Martin v. Waddell, 41 U.S. 234.
U.S. Fish & Wildlife Services (2013), “National hunting license report.” http://wsfrprograms.fws.gov/Subpages/LicenseInfo/HuntingLicCertHistory200420 13.pdf
U.S. Fish & Wildlife Services (2014), “National Wildlife Refuge System.” http://www.fws.gov/refuges/policiesandbudget/budget.html
U.S. Census Bureau (2013), http://www.census.gov/#
MORE ABOUT THE AUTHORS
Mr. Smith has 35 years of experience in environmental and resource management and has published extensively on these topics. He has a master’s degree in engineering from the University of Nevada, Reno. Mr. Smith is the managing director of the Mark E. Smith Foundation and co-founder of Nevadans for Responsible Wildlife Management (www.NRWM.org).
Dr. Molde is a retired physician, former board member of Defenders of Wildlife, and a wildlife advocate with 40 years experience. He is a co-founder of Nevadans for Responsible Wildlife Management (www.NRWM.org).