Mishka: Washington Fish and Wildlife’s first bear dog retires after 12 years of faithful service

Mishka: Washington Fish and Wildlife’s first bear dog retires after 12 years of faithful service

This story was written by Annette Cary, and posted by the Tri-City Herald on March 19, 2015.

While the following story refers mostly to bears, Mishka and his fellow Karelian bear dogs are similarly used to deal with wayward cougars

Washington’s first Karelian bear dog likely has harassed his last bear and sniffed out the wild game bones left behind by a poacher for the final time.

Mishka, after serving the state for 12 years, is headed to a life of leisure after a retirement ceremony Thursday in Kennewick.

He lives on the west side of the state with his handler and owner, Fish and Wildlife officer Bruce Richards, but was honored in Kennewick as the agency’s officers gathered there for training this week.
Photo of Mishka in back of Richards' truck.
Mishka is part of a breed that is instinctively bold with bears and can be trained to track, help capture and then discourage bears from returning to places where they can get in trouble with people.

Mishka solves more bear problems in a year than most officers can in a career, Richards has said. He also is retiring after 41 years with the agency.

The black and white dog started working with biologist Rocky Spencer, helping with cougar research. He would find the carcasses of prey killed by cats being tracked with state collars.

After Spencer died in a helicopter accident, Richards took over his care in a pilot program to see if Karelian bear dogs could be used in game enforcement programs.

“(Mishka) was very good at finding dead bones,” Richards said.

The dog’s first test in the enforcement program was to see if he could locate the bones of a poached elk that state enforcement officers had heard about in the Olympic National Park. They had been unable to find the carcass over the course of a year.

Richards took Mishka on a three-hour hike to an area of the park where the elk was believed to have been shot. Then Richards took the dog’s halter off, a signal that he was working.

Fifteen minutes later, Mishka was back with an elk bone. He had dug below some leaves in a rocky area that would have been difficult for Richards and other officers to search. A bone with saw marks also was discovered, helping wrap up the case.

“He makes one big game case a year usually,” Richards said.

Photo of Mishka with deer fawn.At home with Richards, Mishka is gentle with the orphaned wildlife that Richards’ wife will sometimes bottlefeed for a few days for the Fish and Wildlife Department.

“Fawns go up to Mishka and he adopts them,” Richards said.

He has been socialized to be good with kids. One of Richards’ favorite memories in his years with Mishka was seeing a small boy with spina bifida staring at the dog, obviously entranced, at the state fair in Puyallup.

Richards said the boy, who was not much taller than Mishka, could take him for a walk. The obviously happy child spent 20 minutes slowly and haltingly making his way in a circle around a table, holding Mishka by the collar.

A bear provokes a different reaction from Mishka than the tender side he shows to children and fawns.

“He will go nose to nose with a bear,” Richards said.

Karelian bear dogs are used by the state to track bears and cougars. They hunt like a wolf, tracking and then circling their prey. The dogs are so agile that they can bounce around and evade the attack of a dangerous animal, Richards said.

Mishka and other Karelian bear dogs help harass captured bears as they are released. In a “hard release,” a bear may be shot with rubber bullets and the dogs released to chase it, re-introducing a fear of civilization to the bears.

“Bears are very, very smart and can be taught to stay away from people,” Richards said.

Richards estimates that at least 80 percent of bears trapped and released with the assistance of Mishka avoid becoming repeat offenders, which can lead to them being killed.

Mishka also has been used to confirm that no wild animal is in an area.

In one early case, Richards was called out at night after a couple showed up at Puyallup hospital needing multiple stitches. They had been attacked by a cougar, they said.

But when he and Mishka reached the spot where the couple said they were attacked, Mishka’s hair did not stand up like it does if a cougar is in the vicinity. He ran around like he was chasing rabbits rather than hunting a cougar, Richards said.

When they went back to the couple’s house, they found the couple’s white pit bull in the backyard, covered with blood from attacking its owners.

Without Mishka indicating that there was no cougar, officers could have spent weeks trying to find the nonexistent cougar, and the community would have panicked, Richards said.

Karelian bear dogs were bred for hunting in Finland, where they have been regarded as a national treasure. During World War II Russians killed them, reducing their population to less than 100, Richards said. Today, there are about 400 in the United States.

Mishka came from the kennel of a Florence, Mont., dog breeder, Carrie Hunt. She had traveled to Finland and brought a pair home to the United States to try to save the grizzly bears that were being killed because they became too comfortable around humans in national parks, including Glacier National Park, Richards said.

Mishka can be a handful, Richards said.

“They are called the mule of the dog world – very smart, but very independent,” Richards said.

“The hardest thing to do is teach them to come. They want to go,” he said. He cannot leave a car window unrolled. If Mishka sees something to chase, he’ll be out the window.

However, Mishka is slowing down now. The last time Richards and Mishka were out in the woods, Richards had to lift the dog over a log. His dog is ready to sit in the truck these days, Richards said.

“Mishka has served Washington wildlife enthusiasts well and has more than earned retirement,” he said.

Fish and Wildlife will continue to use five other Karelian bear dogs to help with research, haze bears, assist investigations and locate injured and orphaned wildlife. Three are based in western Washington and two others are based in Wenatchee, where they are used mostly for research.

Other states are considering using Karelian bear dogs in their wildlife enforcement programs, thanks to the success of Washington’s program, Richards said.

Photo of WDFW officers and 6 karelian bear dogs.

Information about how this program began was featured in Barking Up the Right Tree: Washington’s Karelian Bear Dog Program, and listen to our interview On Air with WDFW Officer Jones about the daily life of a warden partnered with a karelian bear dog.

Linking a Cougar Decline, Trophic Cascade, and Catastrophic Regime Shift in Zion

Research Article by William J. Ripple and Robert L. Beschta
College of Forestry, Oregon State University, Forest Resources, Corvallis, OR 97331, United States
published in 2006 by Elsevier in ScienceDirect.

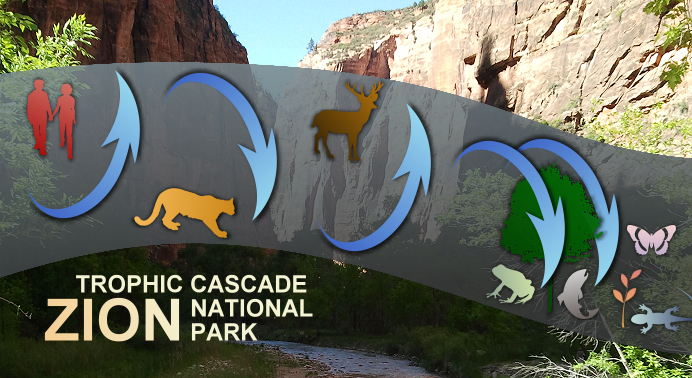
Ripple and Beschta’s work in Zion National Park was one of the first major studies to help demonstrate the importance of top predators in maintaining healthy, diverse landscapes. When the park gained popularity and more people visited, cougars were scared off. Without natural predators, mule deer over-browsed cottonwoods, causing a shift in vegetation, more erosion along stream banks, and ultimately fewer reptiles, amphibians, fish, and insects. These results, replicated in Yellowstone, have broad implications with regard to our understanding of ecosystems where large carnivores have been removed or are being recovered.

Abstract

Thumbnail of paper pdf. Click here to open.

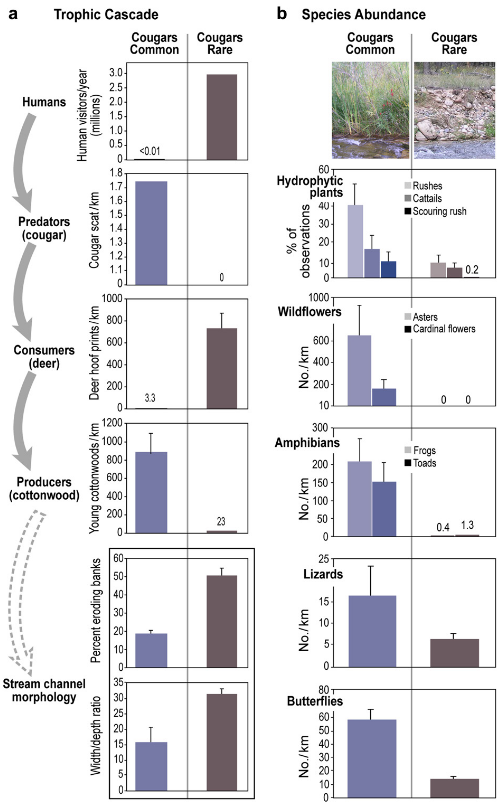
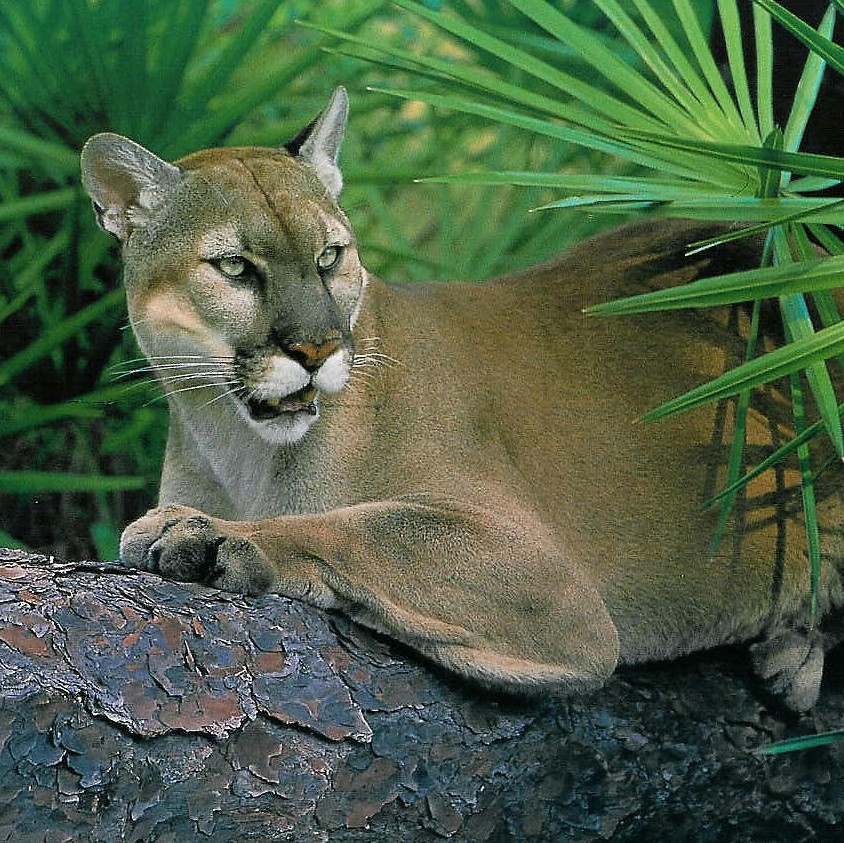
The strength of top-down forces in terrestrial food webs is highly debated as there are few examples illustrating the role of large mammalian carnivores in structuring biotic and abiotic systems. Based on the results of this studywe hypothesize that an increase in human visitation within Zion Canyon of Zion National Park ultimately resulted in a catastrophic regime shift through pathways involving trophic cascades and abiotic environmental changes. Increases in human visitors in Zion Canyon apparently reduced cougar (Puma concolor) densities, which subsequently led to higher mule deer (Odocoileus hemionus) densities, higher browsing intensities and reduced recruitment of riparian cottonwood trees (Populus fremontii), increased bank erosion, and reductions in both terrestrial and aquatic species abundance. These results may have broad implications with regard to our understanding of alternative ecosystem states where large carnivores have been removed or are being recovered.


Introduction

Humans can have a major role in food web dynamics by displacing or extirpating top predators. Over a half century ago, the iconoclast Aldo Leopold was among the first to argue that elimination of large mammalian predators had strong top-down influences on ecosystems (Leopold et al., 1947). Based on widespread empirical observations in the early to mid- 20th century, when large carnivores were being extirpated from significant portions of the United States, Leopold and colleagues suggested that the loss of these carnivores set the stage for ungulate irruptions and ecosystem damage. Perhaps the most notable examplewas the Kaibab plateau in Arizona (Leopold, 1943; Leopold et al., 1947; Ripple and Beschta, 2005). Widely reported in early biology and ecology textbooks as a lesson in top-down importance, the Kaibab study was more recently deleted from textbooks after alternative hypotheses for ungulate irruptions were suggested (Caughley, 1970; Burke, 1973).

Within only one to two centuries the widespread effects of Euro-American settlement and development across the continental United States resulted in range collapse for most large mammalian carnivore species (Laliberte and Ripple, 2004). Yet, potential long-term cascading effects involving the loss of these large carnivores are largely unknown.

Photo of zion with and without cougars poster.

A trophic cascade occurs when the presence of a top predator significantly affects consumers and this interaction alters or influences species composition, age structure, or spatial distribution of producers (plants). While current discussions on terrestrial food webs continue to question the relative strength of top-down forcing versus bottom-up controls (Estes, 1996; Pace et al., 1999; Terborgh et al., 1999, 2001; Polis et al., 2000; Borer et al., 2005), there is often little consideration beyond tri-trophic cascades, especially concerning potential pathways involving changes in the abiotic environment that could contribute to a loss of habitats, a loss of biodiversity, or regime shifts resulting in alternative states (Schmitz et al., 2006). Catastrophic regime shifts can occur when perturbations dramatically alter ecosystem structure and function (Holling, 1986; Scheffer and Carpenter, 2003). A regime shift typically occurs as a relatively abrupt restructuring of an ecosystem, but with prolonged consequences. The likelihood of a shift to a less desired state is increased when humans remove whole trophic levels (top-down forces), thereby reducing an ecosystem’s capacity to generate services (Folke et al., 2004).

From a theoretical perspective, a major academic debate regarding trophic cascades was initiated when Hairston, Smith, and Slobodkin proposed the Green World Hypothesis, which indicated that predators maintain global plant biomass at high levels by limiting herbivore densities (Hairston et al., 1960). Yet even with recent advances in food web ecology, the debate about the Green World Hypothesis continues due to ongoing disagreement on the frequency and relative role of top-down versus bottom-up forces, as well as a paucity of studies regarding the effects of large mammalian predators on terrestrial vegetation (Pace et al., 1999; Polis et al., 2000; Shurin et al., 2002; Borer et al., 2005).

Ecosystem properties and processes in the presence or absence of large carnivores are not widely understood. For example, there is a lack of controlled, large-scale, and long-term studies of large carnivores, prey, and plant communities. This scarcity of research is attributable to a lack of functional populations of large carnivores, the cost of such studies, the need for relatively large spatial and temporal scales, the difficulty of experimentally manipulating populations of large carnivores, and the problem of separating confounding effects including the role of humans. To date, the vast majority of trophic cascades studies in terrestrial ecosystems have taken place at the scale of meters to hectares involving very small predators over short time periods. This limits the transfer of results to large landscapes, large carnivores, and long time scales (Schmitz, 2005).

Photo of mule deer with fawn.

A top-down trophic cascades model would predict an increase in consumer biomass and a decrease in producer biomass following predator removal, while the bottom-up model would predict little or no change in consumer or producer biomass after their removal (Ray et al., 2005). In addition to these basic top-down linkages, many other interaction pathways resulting from predator effects are likely, such as increased species interactions, improved nutrient cycling, limited mesopredator populations, and food web support for scavengers (Soulé et al., 2003, 2005; Côté et al., 2004; Reisewitz et al., 2006). One little known pathway is a linkage from predators to consumers to producers to streambank habitats to species abundance (i.e., how the change in abiotic environment due to trophic cascades affects the occurrence of native species).

Herein we report on a discovery that appears to link the loss of predators to a catastrophic regime shift via trophic cascades (cougar → deer → cottonwoods) and changes in abiotic environmental conditions (channel morphology). We took advantage of an unplanned landscape-scale experiment to document the status of an ecosystem where the presence of a large mammalian predator (cougar) had been greatly diminished in one of two landscape areas within Zion National Park, Utah. While an experimental design that includes spatial control of “predator rare” versus “predator common” areas seldom occurs in large carnivore-trophic cascades research (Terborgh et al., 2001), such a design greatly reduces the potential for confounding interactions associated with climate, natural disturbances, or habitat. An underlying hypothesis of this study is that Fremont cottonwood tree recruitment: (1) has been low in areas where cougars are scarce and mule deer abundant (treatment, Zion Canyon); and (2) has continued to occur in areas where cougars remain common and deer scarce (control, North Creek). Additionally, in the area with a reduced cougar presence, we hypothesized that reductions in riparian trees and other palatable hydrophytic plants caused increases in bank erosion, which in turn contributed to reductions in the abundance of riparian wildflowers, amphibians, lizards, and butterflies. We considered alternative hypotheses that might affect cottonwood recruitment including climate, human interventions to stream channels, and differences in geomorphology and runoff regimes between Zion Canyon and North Creek.


History of Zion Canyon

When Zion Canyon was first settled in 1862, ranchers and homesteaders found lush vegetation in the valley bottoms and excellent grass and browse in the uplands (Dixon and Sumner, 1939). During the next five decades agricultural use of bottomlands and heavy grazing eventually caused channels to destabilize and by 1915 most homesteads had been abandoned. By 1918, when Zion National Park was established, much of the natural vegetation in the canyon had been greatly diminished and the canyon deer population was at a very low level due to intense hunting (Presnall, 1938). However, by the late 1920s vegetation recovery in the canyon was underway and deer numbers had begun to increase (Presnall, 1938). Predators also returned during this 10-year period and thus kept the deer population at a low level (Smith, 1943).

Park development accelerated during the late 1920s resulting in a dramatic increase in the annual number of park visitors, from 8400 in 1924 to 68,800 in 1934. Consequently, a reduction in the canyon’s cougar density was first noted in 1934. Zion Park Naturalist Presnall (1938) wrote “Human use of the park was, and no doubt always will be, concentrated in Zion Canyon, causing profound changes in the delicate balance between deer and their natural predators”. National Park Service biologists Dixon and Sumner (1939) similarly indicated that “The presence of these hundreds of human visitors tended to drive out the cougars, which are the chief natural enemies of the deer”. Superintendent Smith (1943) retrospectively wrote “A period of expansion in the park followed from 1924 to 1934 with the construction of highways and trails and a resulting heavy increase in visitor use which tended to frighten off the predators in the canyon due to the concentration of people”.


Study Areas

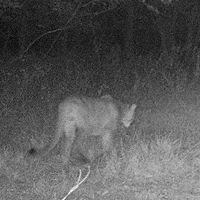
As cougars have been displaced from Zion Canyon by large numbers of human visitors since the 1930s, we used this as one of two primary study areas. Our second study area, the North Creek drainage immediately west and adjacent to Zion Canyon, is a roadless area which, like other backcountry areas of Zion National Park, has a history of supporting a stable cougar population (Nile Sorenson, Utah Division of Wildlife, personal communication, 2005). Cougar hunting is prohibited within Zion National Park but occurs outside the park. Thus, canyons within the park like those along North Creek generally serve as refugia for cougars. According to Zion National Park archival files (Zion 16051, folder 15), after the 1930s tracks and other cougar sign were found in most every section of the park outside of Zion Canyon. Currently, the park is part of a Utah state wildlife management unit encompassing nearly 4500 km2 with an estimated mule deer population of approximately 7200 (1.6 deer/km2) and an estimated cougar population of 77-110 (17-25 cougar/1000 km2; Utah Division of Wildlife files). Other predators in the Zion National Park include coyotes (Canis latrans) and a few black bears (Ursus americanus). Both of these species prey on mule deer, but mostly on newborn fawns in the spring of the year.

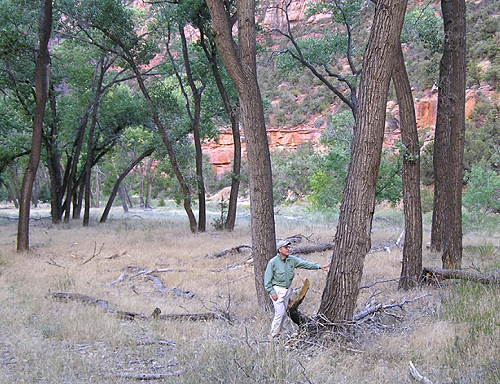
Present-day Zion Canyon resulted from geologic down-cutting by the North Fork of the Virgin River through Jurassic rock units of the Markagunt Plateau. Modern terraces (former floodplains) along the canyon bottom contain a variety of dry-site grasses and herbaceous plants as well as Fremont cottonwood, boxelder (Acer negundo), and ash (Fraxinus spp.) trees. Scattered patches of Baccharis (Baccharis sp.) occur within the active channel. During the 1930s the National Park Service constructed rock and wire revetments (gabions) to stabilize streambanks in portions of Zion Canyon. These efforts tended to disconnect the river from its floodplain by reducing occurrence of overbank flows. Since bare substrates are typically important sites for cottonwood regeneration (Stromberg, 1998), this altered hydrologic connectivity of a river with its floodplain thus represents a potentially significant factor affecting cottonwood recruitment. A general lack of cottonwood recruitment (i.e., growth of cottonwood seedlings into trees) over a period of many years in Zion Canyon riparian areas (Fig. 1) has caused the Park Service to investigate channel alterations as a possible approach for improving cottonwood recruitment and reversing riparian degradation (McMahon et al., 2001; Steens-Adams, 2002).

FIGURE 1

Photo of man standing in front of large cottonwoods in grassy field.

Photograph taken in 2004 of the historical floodplain along the North Fork of the Virgin River in Zion Canyon showing mature Fremont cottonwoods and a lack of cottonwood recruitment over a period of several decades.


We selected North Creek as a control for our study since its watershed is adjacent to Zion Canyon (North Fork of the Virgin River) and thus has similar geology, climate, and plant communities. The elevations for our study reaches, located ~15 km apart, were both ~1300 m; watershed areas were 760 km2; and 170 km2; for Zion Canyon and North Creek, respectively. High cliffs mostly impassable to mammals separate the North Creek watershed from the North Fork of the Virgin River watershed. Human use in the North Creek study area involves limited numbers of hikers annually, whereas nearly 3 million people currently visit Zion Canyon each year.


Methods

Historical mule deer population estimates were obtained from Zion Canyon census data. These estimates were adjusted (multiplied) by a factor of 2.4, an average from two population studies [2.2 from Presnall (1938) and 2.6 from Moorehead (1976)], to account for deer present but not observed.

Within Zion Canyon, an area with high human visitation and low cougar densities since the mid-1930s, we measured the diameter of all Fremont cottonwood trees ≥1 cm in diameter at breast height (DBH) in riparian areas along three 700—900m reaches. These relatively long sample reaches were undertaken to encompass all cottonwoods within a given section of the river. The Riverwalk Reach occurs immediately upstream of the Temple of Sinawava parking lot, and has had no history of channelization or bank stabilization work. The Hereford Reach extends downstream of the parking lot and is generally free of revetments although fill from historical road construction has impinged on one streambank for a portion of the reach. Continuing downstream, the Big Bend Reach has had a history of revetment construction; however, over time the effectiveness of these structures has decreased as they have been eroded or partially buried by alluvial deposits.

In the North Creek drainage, where cougars have continued to inhabit the area, we measured the DBH of all cottonwoods (≥1 cm) along three 200m reaches, one each along the Left Fork, the Right Fork, and the main stem of North Creek. Roads and revetments are absent along study reaches in the North Fork area.

For both study areas we obtained increment cores from a subset of measured cottonwoods (≥5 cm DBH), coring individual trees 1.4m above the ground. We used this information to establish age-diameter relationships for estimating ages of uncored trees, adding 7 years to the number of rings to account for tree height growth from ground level to 1.4 m above the ground.

Measured tree diameters, in conjunction with an age- diameter relationship, were used to develop historical trends in cottonwood tree recruitment for both study areas (e.g., Beschta, 2005). Based on these trends (extending a century back in time), we quantified the strength of top-down forces in Zion Canyon in comparison to those in the North Creek drainage. To assess the strength of any potential trophic cascade, we used the natural log ratio (Borer et al., 2005) of cottonwood trees within each 10-year age class for the North Creek area (control) relative to the Zion Canyon area (treatment). The average log ratio (ū) of cottonwood frequencies was calculated by:


k
ū = ∑ [ln(yj/zj)]/k,
j=1


where yj is the average number of cottonwoods per kilometer that established in “cougars common” reaches during the jth decade, zj is average number of cottonwoods per kilometer that established in “cougars scarce” reaches during the jth decade, and k is number of decades. Decadal log ratios were averaged over two time periods: (1) before cougars became scarce (1910-1940); and (2) after cougars became scarce in Zion Canyon (1940-2000).

To further assess potential cascading effects, we undertook systematic surveys of channel dimensions, streambank condition, and hydrophytic vegetation along each study reach in late September 2005. Along the North Fork of the Virgin River in Zion Canyon, we determined wetted width, thalweg depth (deepest portion of water column), and active channel width at 10-m intervals within 400-m portions of each study reach in early September 2005, using these to calculate a wetted width/thalweg depth ratio for the reach.

Photo of rocky river bank in Zion.

We took the same type of measurements in the North Creek drainage, but since these streams were smaller, the interval between measurements was 5 m along each 200-m study reach. During reach surveys, the presence of an eroding bank and the dominant hydrophytic vegetation was determined at the genus level [rushes (Juncus spp.), cattails (Typha sp.), scouring rush (Equisetum sp.)] within a 0.25m2area of streambank at the edge of the channel. Both were recorded at 5-m intervals for each side of the channel.

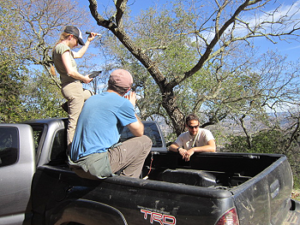
To assess biodiversity, we determined the relative abundance of selected indicator species, using visual encounter surveys conducted along the bank on each side of the channel. All indicator species were easily observable and occurred in both study areas. We undertook these surveys on clear sunny days during the 16-20 September 2005, between 1000 and 1700 h. Species counts involved scanning the ground surface within 2-m wide transects along the streambanks of the study reaches (Heyer et al., 1994). Surveys were completed for cardinal flower (Lobelia cardinalis), Welsh aster (Aster welshii), red spotted toad (Bufo punctatus), canyon tree frog (Hyla arenicola), and all lizard species. To determine the relative abundance of deer, we recorded each hoofprint within these belt transects. Butterflies encountered within 10-m wide belt transects along the banks of each study reach were recorded at the subfamily level. Close focusing binoculars were used to help identify lizard species and butterfly subfamilies. To index the relative abundance of cougar, we conducted a survey of fecal droppings (scat) along ∼4000m of extant foot trails in both North Creek and Zion Canyon study areas, quantifying cougar droppings as number of droppings per linear kilometer of trail.


Results

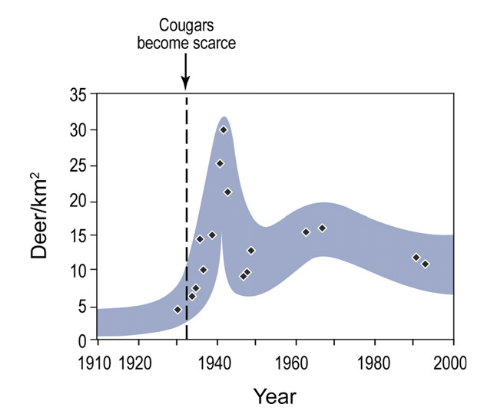
With increasing numbers of park visitors and decreasing numbers of cougars throughout the 1930s, the Zion Canyon deer population irrupted from <80 in 1930 (<4 deer/km2) to a peak of ∼600 (30 deer/km2) in 1942 (Fig. 2, Table 1). Because of impacts to vegetation, park officials trapped and removed 116 deer in 1938 (Dixon and Sumner, 1939) and shot and killed 180 more deer in 1943 (Fagergren, 1943). Between 1938 and 1947, 780 deer were killed or removed from Zion Canyon by the Park Service (National Park Service Archives, Zion 16051, folder 15). Since the 1940s canyon deer populations have declined to a recent estimate of ∼200 animals (∼10 deer/km2), which is greater than the pre-1930 levels (Fig. 2) as well as current mule deer densities outside the park (1.6 deer/km2).

FIGURE 2

Graph showing deer population spike immediately after cougars become scarce in 1930s, followed by a rapid reduction, and then level out after 1960.

Estimated number of mule deer in Zion Canyon during the 20th century. Cougars became scarce in Zion canyon by the mid-1930s, a period of dramatic increase in park visitation. The shaded band represents an estimate of uncertainty.

Sources: Mule deer data from Presnall (1938), Dixon and Sumner (1939), and the following reports located in the Zion National Park archives — 1930 Zion Park Superintendent report; 1943 chief ranger report by F.C. Fagergren; anonymous memorandum on resurgence of pink eye, 21 December 1993; National Park Service Archives, Zion 16051, folders 15 and 16.


Table 1 – Reported observations regarding cougar, mule deer, and vegetation in Zion Canyon for 1932-1942
Date Comment
1932 “The deer within the park are increasing in spite of hunting outside…”
1933 “Cougar signs were quite numerous within Zion Canyon this year.”
1934 “Evidence of cougars within the park is more readily observed, indicating perhaps they are somewhat on the increase. However, they do not come into the valley of Zion Canyon, which is one of the factors assisting in the increase of the deer population here.”
1935 “Deer are in the best of condition, and forage is plentiful, because of the large amount of moisture received during the winter and spring.”
1936 “Evidence of [deer] overpopulation in the valley of Zion Canyon, however, continues to be seen… there are about 125 deer that winter here… the number of cougar within the park is increasing [outside of Zion Canyon].”
1937 “The over-population of deer in Zion Canyon, which was reaching the stage where plans for reduction were under discussion, was somewhat relieved by the severe winter of 1936-1937, which some of the less healthy animals were unable to survive.”
1938 “The deer in Zion [canyon] are in very poor flesh and present a sorry spectacle. Professional wildlife visitors to the park this summer have been unfavorably impressed by the unbalanced deer forage situation here.”
1939 “Deer became too numerous on the valley floor for the amount of forage available, so 130 of these animals were trapped and transported to outside areas.”
1940 “The trapping and shipping of surplus Rocky Mountain mule deer from the floor of Zion Canon was carried on… 62 animals were removed from the park this year.”
1941 [Report not available]
1942 “Overpopulation of deer in Zion Canyon, with consequent scarcity of feed, is one of the major problems at present in Zion National Park. During the winter of 1941-1942, 52 deer were trapped and removed… Vegetation is so over-browsed that it is in serious condition and there is danger of complete destruction.”
Source: Annual reports by the superintendent of Zion National Park, ZNP Archives.


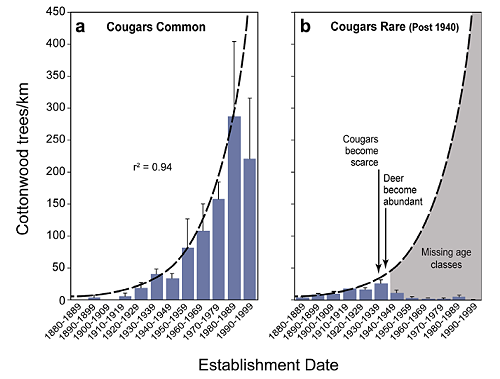
The number of tree rings (t) was highly correlated with DBH (x) for cottonwoods in Zion National Park (r2 = 0.75, n = 51, t = -0.0096x2 + 2.09x). Based on estimated cottonwood ages from DBH measurements in the sampled reaches, two age structures are apparent when comparing the North Creek study reaches with those of Zion Canyon. The North Creek area (Fig. 3a) shows continuous recruitment over time with more young trees than old ones — a normal feature of functioning gallery forests (Beschta, 2005).

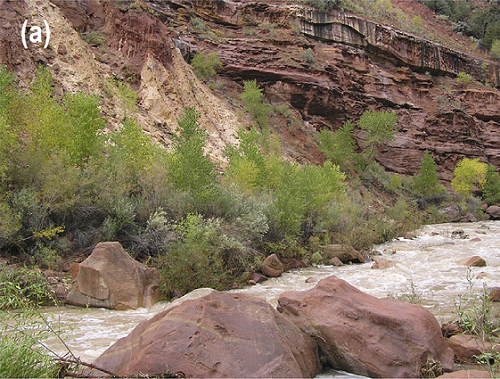
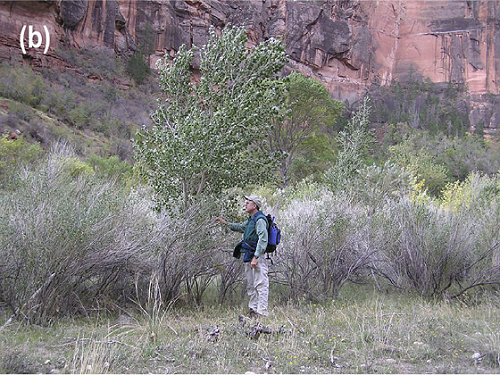
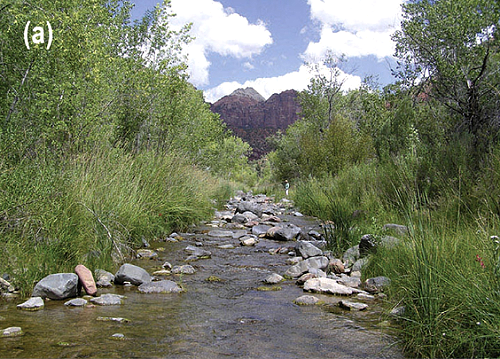
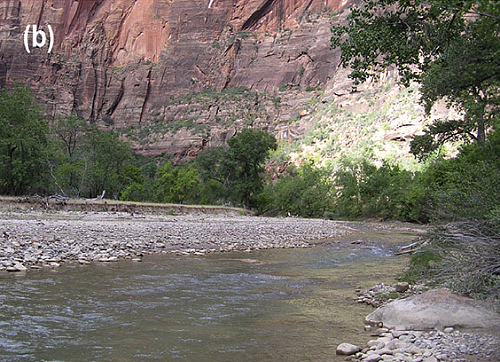
In contrast, study reaches in Zion Canyon (Fig. 3b) show a general paucity of young trees and a lack of recruitment since the 1930s as an apparent result of heavy browsing pressure since then. As an index of the relative strength of this potential trophic cascade, the average log ratio of cottonwood frequencies for the North Creek/Zion Canyon areas was near zero (-0.25) for the decades before cougars became scarce in Zion National Park and relatively high (3.85) afterward. While some young cottonwoods had established in Zion Canyon during the 1970s and 1980s (Fig. 3b), nearly all were observed growing in refugia sites inaccessible to deer, such as the base of steep slopes along the river (Fig. 4a) or within the protection of Baccharis (a relatively unpalatable shrub) thickets (Fig. 4b).

FIGURE 3

Two graphs sidebyside. A shows cottonwood trees increase over time when cougars common. B shows cottonwoods decline after cougars become scarce.

Cottonwood age structure for (a) the North Creek area where cougars are common and (b) Zion Canyon where they are rare. Both areas are within Zion National Park. The exponential function (dashed line) was fitted to measured tree frequencies for North Creek study reaches; this same relationship has been plotted along with tree frequencies for the Zion Canyon study reaches illustrating a general cessation of cottonwood recruitment (i.e., missing age classes) since ~1940. Error bars represent standard errors.


FIGURE 4

Riverbank with young cottonwood trees.

Dense brush scraggly thicket.

Photographs taken in 2004 showing young cottonwood recruitment (2-4 m tall) at sites protected from deer browsing in Zion Canyon along the North Fork of the Virgin River. Refugia shown include (a) a site between the canyon wall and the channel, and (b) Baccharis thickets.


As suggested by food-web theory, Fig. 5a shows an alternating pattern of biomass levels across trophic levels. In the North Creek area (control), human and consumer levels show low abundance while predator and producer trophic levels show high abundance. In Zion Canyon (treatment), the opposite pattern occurs. Although streams throughout Zion National Park experienced high flows (10—20 year return period) in January 2005, the occurrence of eroding banks for study reaches in Zion Canyon were >2.5 times as frequent as those in the North Creek area (Fig. 5a). Similarly, width/depth ratios for reaches in Zion Canyon are approximately double those in the North Creek area. For the Zion Canyon reaches active channel widths (x = 34.2 m, standard error [SE] = 1.4 m) were more than double the wetted widths (x = 15.9m, SE = 0.4 m) as a result of bank erosion into historical floodplains, which created large areas of exposed gravels along these reaches.

FIGURE 5

Two graphs columns. A shows trophic cascade and B shows species abundance. When cougars are rare, deer increase, over browse and ultimately all other species decline.

(a) Trophic cascade indicated by inverse patterns of abundance across trophic levels and (b) observed biodiversity indicators for “cougars common” and “cougars rare” areas of Zion National Park USA. Species include Fremont cottonwood originating since 1940 (Populus fremontii), rushes (Juncus spp.), cattails (Typha sp.), scouring rush (Equisetum sp.), Welsh aster (Aster welshii), cardinal flower (Lobelia cardinalis), canyon tree frogs (Hyla arenicola), red spotted toads (Bufo punctatus). See text for a list of observed lizard species and butterfly subfamilies. Error bars represent standard errors.


The relative abundance of hydrophytic plants, wildflowers, amphibians, lizards, and butterflies observed along streams in the North Creek area was higher than in Zion Canyon (Fig. 5b). Neither of the wildflower species were observed within the belt transects in Zion Canyon, but both were found growing outside the belt transects in nearby side canyon areas, physically protected from deer browsing. Lizard species observed in both “cougars common” and “cougars rare” areas include: Eastern Fence Lizard (Sceloporus undulatus), Sagebrush Lizard (Sceloporus graciosus), and Plateau Whiptail (Cnemidophorus velox). Additional lizard species observed in the “cougars common” area include: Desert Spiny Lizard (Sceloporus magister), Common Side-Blotched Lizard (Uta stansburiana), and Tree Lizard (Uta ornata). Butterfly subfamilies observed in both the “cougars common” and “cougars rare” areas include (scientific names listed as family: subfamily): Whites (Pieridae: Pierinae), True Brush-Foots (Nymphalidae: Nymphalinae), Admirals (Nymphalidae: Limenitidinae), and Grass Skippers (Hesperiidae: Hesperiinae). Additional butterfly subfamilies observed only in the cougars common area include: Swallowtails (Papilionidae: Papilioninae), Sulphurs (Pieridae: Coliadinae), Blues (Lycaenidae: Polyommatinae), Satyrs (Nymphalidae: Satyrinae), Monarchs (Nymphalidae: Danainae), and Spread-wing Skippers (Hesperiidae: Pyrginae).


Discussion

Our data confirm a major gap in the cottonwood age structure in Zion Canyon (cougars rare) occurred after 1940, where we found, on average, only 23 post-1940 cottonwoods per kilometer of stream (Fig. 3). This compares to 892 post-1940 cottonwoods per kilometer in the North Creek study reaches (cougars common). These results are consistent with a trophic cascade initiated regime shift in that the reduction in a large predator may have produced important ecosystem changes, including greater herbivore densities, decreased tree frequencies, more bank erosion, altered channel dimensions, and decreased riparian biodiversity (Fig. 6).

FIGURE 6

Riverbank with young trees, healthy mix of vegetation and stream.

Rocky bare riverbank with little vegetation.

Photographs taken in 2005 showing stream channel and floodplain conditions along (a) North Creek, an area with cougars common, and (b) North Fork of the Virgin River in Zion Canyon, an area with cougars rare. The stream in (a) shows well vegetated and stable banks and a small width:depth ratio while the stream in (b) has a lack of bank vegetation, a large width:depth ratio, and a wide active channel (with banks continuing to erode).


The geomorphic transformation of stream channels due to accelerated bank erosion can have serious ecological consequences (National Research Council, 2002). For example, plant loss on streambanks decreases shading on the surface of the water and allows width/depth to increase, thus contributing to high summertime water temperatures. Increased streambank erosion not only removes formerly deposited alluvium that serves as substrate for riparian vegetation, but reduces the capability of the stream to maintain hydrologic connectivity with its historical floodplain (Beschta and Ripple, 2006). Bank erosion also truncates allochthonous inputs from streamside vegetation, an important source of organic carbon for many aquatic organisms. An influx of finer sediments from accelerated bank erosion can decrease the median substrate size and sorting of sedimentary material in the bed, making it less inhabitable for many invertebrates that live within the interstices of the coarse bed materials (Smith, 2004). While large portions of the channel in Zion Canyon now have bare substrates normally favorable for cottonwood seedling establishment (Fig. 6b), it appears that annual herbivory since 1940 has effectively truncated the capability of seedlings to grow above the browse level of deer.

Not only do hydrophytic plants have a key role along channel margins in helping to maintain stable banks and performing other important functions, but they also provide food-web support and protective cover for amphibians, reptiles, and aquatic species. Both wildflower species assessed in this study grow in wet meadows and on moist streambanks and serve as host plants for several butterfly species. Relative low numbers of frogs, toads, and lizards associated with the “cougars rare” sites may be a result of both lower levels of invertebrate prey abundance, as well as degraded habitats with less cover for thermal regulation and protection against predators. Butterfly differences may be due to reduced diversity and abundance of flowering plants in Zion Canyon relative to the North Creek area. It should be noted that the results from our survey of amphibians, lizards and butterflies within the belt transects represent what we observed over a limited period of time and should not be considered an exhaustive inventory of these species groups. We also observed a wide range of woody browse species such as willow (Salix spp.), Squawbush (Rhus trilobata), and others in the North Creek drainage, which were absent or rare on comparable sites in Zion Canyon.

Our results are consistent with previous studies regarding the role of wolves (Canis lupus) in trophic cascades (McLaren and Peterson, 1994; Ripple and Larsen, 2000; Ripple and Beschta, 2004; Beschta, 2005; Hebblewhite et al., 2005). These studies and others (Rooney and Waller, 2003) indicate that ecosystems can be profoundly altered by ungulates after large carnivores are removed. Recent research has also connected wolves to stream channel and floodplain characteristics. For example, heavy elk browsing of willow communities after the loss of wolves ultimately generated major changes in floodplain functions and channel morphology (Beschta and Ripple, 2006). Other researchers have documented a reduction in abundance and diversity of birds in areas without wolves and with abundant ungulate populations (McShea and Rappole, 2000; Berger et al., 2001). Like wolves, cougars are a wide-ranging predator whose geographic distribution and predation effects have been greatly reduced by humans. In contrast to wolves, cougars are solitary predators.

Photo of cougar taking down a mule deer.

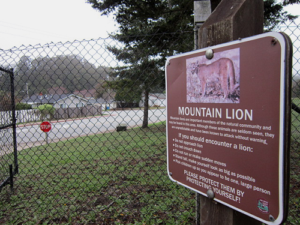
Mule deer represents the primary prey of cougars in southern Utah and are common across much of the region. However, cougars generally have avoided areas with high levels of human activity (Van Dyke et al., 1986), such as Zion Canyon. Thus Zion Canyon functions as refugia for mule deer from cougar predation due to high human presence, while areas such as the North Creek drainage provide refugia for cougars due to low human presence. These landscape-scale refugia are consistent with behaviorally mediated trophic cascades theory involving predation risk effects (Ripple and Beschta, 2004; Hebblewhite et al., 2005).

The natural log ratio of 3.85 (indicating a 47-fold difference) for young cottonwood frequencies in our control area (North Creek drainage) versus treatment area (Zion Canyon) ranks high compared to a recent meta-analysis of 114 trophic cascades studies from both aquatic and terrestrial systems, where such log ratios ranged from -0.7 to 3.2 (Borer et al., 2005). Thus, the diminishment of gallery cottonwood forests (and perhaps a wide range of other palatable species) reflects a potentially strong trophic cascade effect relative to other studies. Additionally, our results document an apparent catastrophic regime shift using a pathway spanning from trophic cascades to impacts on the abiotic environment, and ultimately, to a loss of native species abundance. Thus, the sustainability of functional riparian habitats and biodiversity may require the long-term effects of predation on herbivores, including lethal effects (densities) as well as nonlethal effects (predation risk).

Our findings on trophic cascades in Zion National Park are consistent with those of over a half century ago by Aldo Leopold regarding the Kaibab Plateau, located less than 100 km to the southeast. Zion serves as a replicate to the classic Kaibab study, since cougar/mule deer are the primary predator/prey combination in both areas. In addition, recent analyses of aspen tree rings from the Kaibab (Binkley et al., 2005) are consistent with Leopold’s hypothesis of extreme deer herbivory following predator removal, as well as the importance of predation in controlling deer populations. Aspen recruitment on the Kaibab largely terminated following predator reductions, similar to the patterns of cottonwood recruitment in Zion Canyon after cougars became scarce.

It is interesting to note that increased cougar sightings have occurred in Zion Canyon in recent years. This may be attributable to the dramatic decrease in vehicle traffic since a bus system was implemented in 2000. Reduced vehicle traffic may have positive effects on long-term riparian/aquatic biodiversity if cougars have an increasing presence in Zion Canyon. However, we are unsure how rapidly or to what extent any increase in cougar numbers in Zion Canyon might be able to reverse decades of direct impacts by deer upon riparian plant communities and subsequent impacts to the stream system.

While our results are consistent with trophic cascade theory, we nevertheless considered alternative scenarios that might affect cottonwood recruitment: (1) fluctuations in climate; (2) human interventions to channels (e.g., revetments in Zion Canyon); and (3) site attributes associated with differences in geomorphology or runoff regimes between Zion Canyon and North Creek. Both Zion Canyon and North Creek study areas had comparable cottonwood recruitment during the pre-1940 period (Fig. 3), indicating they were well-paired for comparative purposes. Thus, it would appear unlikely that any shifts in climate during the 20th century have been a significant factor associated with the post-1940 cessation of cottonwood recruitment in Zion Canyon, as a similar pattern was not observed in North Creek.

Photo of hikers on revetment.

We considered the potential role of revetments constructed in the early 1930s along portions of the North Fork of the Virgin River in Zion Canyon. Such structures can diminish cottonwood recruitment by locally reducing: (1) availability of bare substrates (important for cottonwood germination); and (2) occurrence of overbank flows. Since construction of these structures decades ago, their capability to function has slowly deteriorated as they have been increasingly eroded or buried by alluvium during periods of high flow. Furthermore, our results indicated relatively low cottonwood recruitment since 1940, even in those reaches of Zion Canyon where revetments had not been constructed. Thus, some mechanism other than revetment construction appears to have been causing the post-1940 lack of cottonwood recruitment. This is further supported by observations in Zion Canyon which indicate that cottonwood recruitment is occurring, but only in localized places generally inaccessible to deer (e.g., steep canyon toeslopes, Baccharis thickets, Fig. 4).We generally observed extremely high levels of deer browsing on cottonwood seedlings in Zion Canyon, but very low levels of browsing on seedlings in the North Creek area.

Drainage areas and geomorphic features associated with Zion Canyon and the North Creek areas represent essentially constant conditions over our study period and thus are an unlikely candidate for causing a differential effect on cottonwood recruitment over time. However, to explore this issue further we measured cottonwood trees, channel width/depth ratios, and percent eroding banks along a 400-m reach of the East Fork of the Virgin River. Land use history in the East Fork during the late 1800s and early 1900s was similar to that which occurred in Zion Canyon. However, since inclusion into the Zion National Park in 1918, the East Fork has not had any roads or revetments, has experienced only a few human visitors annually, and has had continued presence of cougars. Although the East Fork has a drainage area approximately the same as that of Zion Canyon, annual peak flows average approximately 30% lower.

Along the East Fork we found 1216 young cottonwoods per kilometer (originating post-1940), with an exponential ageclass distribution very much like that of study reaches in the North Creek drainage (i.e., Fig. 3a). The frequency of eroding banks averaged only 2% for the East Fork relative to 18.9% (SE = 1.3%) for study reaches in the North Creek drainage. Both were well less than the 51.0% (SE = 3.6%) eroding banks measured in Zion Canyon. In addition, the average wetted width/depth ratio of 12.9 m/m for the East Fork was similar to the North Creek study reaches (x = 15.6m/m, SE = 4.7 m/m), but considerably less than that for Zion Canyon (x = 31.1m/m, SE = 1.6). These findings support our contention that pre-park land use history as well as stream/watershed size did not cause the post-1940 lack of cottonwood recruitment in Zion Canyon.

FIGURE 7

Graph showing more of each species in areas where cougars are common vs areas where cougars are rare.

Native fish densities from two “cougars common” areas (North Creek and East Fork of the Virgin River) and one “cougars rare” area (North Fork of the Virgin River). Species include flannelmouth sucker (Catostomus latipinnis), desert sucker (Catostomus clarki), speckled dace (Rhinichthys osculus), and Virgin spinedace (Lepidomeda mollispinis). Error bars represent standard errors for all species combined. Sources: Morvilius et al. (2006) and Utah Division of Wildlife Resources (unpublished data).


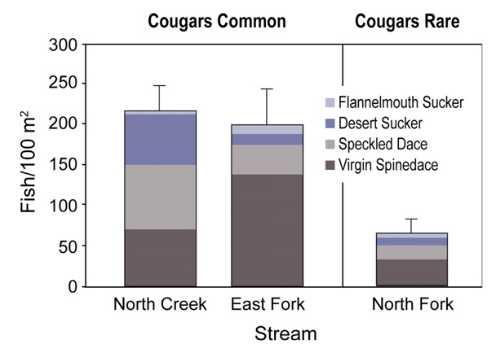
We postulated that the apparent regime shift in riparian plant communities and channel morphology may have influenced native fish species abundance in the North Fork of the Virgin River. Therefore, we summarized recent fish surveys for North Creek, as well as for both the North and East Forks of the Virgin River. Annual monitoring of these streams has been ongoing since 1994 (n = 11 years) and is accomplished at one fixed area station per stream using electro-shocking methods (Morvilius et al., 2006). Summaries of these annual data show mean densities of native fish over three times higher in streams within areas with cougars common (North Creek and East Fork of the Virgin River) relative to the area with cougars rare (North Fork of the Virgin River, Fig. 7). Virgin spindace (Lepidomeda mollispinis), one of four native species found in these surveys, has been proposed for federal endangered species listing because of declining populations due to habitat degradation (Morvilius et al., 2006). These results provide additional evidence of potential connectivity between terrestrial and aquatic processes linked by a trophic cascade across ecosystems, a process rarely identified in the ecological literature (Knight et al., 2005).

We hypothesize that the lack of cottonwood recruitment associated with riparian areas in Zion Canyon indicates an altered trophic cascade involving decades of low cougar densities. Subsequent impacts to the riparian/aquatic systems appear to have included reduced bank vegetation, increased bank erosion and width/depth ratios, and decreased riparian biodiversity. Thus, removing or maintaining a large carnivore appears to have had profound effects on lower trophic levels, as well as multiple indicators of ecosystem status and native species abundance. Unless changes occur at the top of the food chain, Fremont cottonwoods in Zion Canyon may ultimately disappear. While loss of cottonwoods alone represents a major impact to biodiversity, it likely chronicles other functional losses already incurred by the larger community of riparian plants and animals. In contrast, where access by humans has been restricted and cougar populations have remained intact, as in the North Creek area, browsing levels have remained relatively low, as indicated by long-term patterns of cottonwood recruitment. Furthermore, streambank erosion was low, channels relatively narrow and deep, and relative abundances of hydrophytic plants and other indicator species of biodiversity were high in this area.

WATCH LORDS OF NATURE

Photo of Lord of Nature video, click here to watch.

Top predators may hold a key to life itself. Can people and predators coexist? Can we afford not to? Birds, butterflies, beaver and antelope, wildflowers and frogs—could their survival possibly be connected to top predators like the wolf and cougar? This captivating documentary goes behind the scenes with leading scientists to explore the role top predators play in restoring and maintaining ecosystems and biodiversity

Understanding the historical context of various factors affecting Zion Canyon and North Creek ecosystems is fundamental to interpreting present-day ecosystem structure and functions. This indicates not only an important need to understand how ecosystems affected by humans currently function in comparison to relatively unaffected ecosystems, but that historical patterns of human disturbances and alterations leading up to the present need be understood so that on-going effects can be realistically evaluated. With the assistance of cottonwood age—diameter relationships and stand measurements of tree diameters, we were able to reach back over a century to help assess temporal stand structural dynamics of the gallery forests within our study sites. However, without the availability of control reaches (where cougar populations remained intact over time), we would have been unable to decipher the potential effects of predator removal on abiotic indicators of ecosystem conditions and on other biotic indicators with life cycles much shorter than cottonwoods.

Our results identify a central issue for ecological studies, since the presence or absence of a top predator may have a major influence on the outcomes of such studies. Following the loss of top-down control, succession may proceed via abrupt regime shifts and alternative states (Folke et al., 2004; Schmitz et al., 2006). Without an appreciation of this context, future studies, as well as many currently in the published literature, are likely to provide conflicting results regarding function and structure of perturbed ecosystems. This may be true not only for those in southern Utah, but also across many ecosystems in the United States and around the world, where key predators (large mammalian carnivores) have been removed and consumers (e.g., increased wild ungulate populations; high densities of domestic ungulates) have significantly affected native species biodiversity.


Acknowledgements

The authors thank Cristina Eisenberg, Sally Hacker, Brian Miller, Deanna Olson, Dan Rosenberg, and Oswald Schmitz for helpful comments on an early draft of this paper; additional comments and suggestions were provided by three anonymous reviewers. Funding was provided by the National Park Service, Cooperative Agreement CA# H1200040002. Dave Sharrow and Denise Louise of Zion National Park provided technical assistance on this project. Richard Fridell and Megan Morvilius of the Utah Division of Wildlife Resources provided the fish data used in this manuscript.


References

Berger, J., Stacey, P.B., Bellis, L., Johnson, M.P., 2001. A mammalian predator-prey imbalance: grizzly bear and wolf extinction affect avian neotropical migrants. Ecological Applications 11, 967—980.

Beschta, R.L., 2005. Reduced cottonwood recruitment following extirpation of wolves in Yellowstone’s northern range. Ecology 86, 391—403.

Beschta, R.L., Ripple,W.J., 2006. River channel dynamics following extirpation of wolves in northwestern Yellowstone National Park. Earth Surface Processes and Landforms, doi:10.1002/esp. 1362.

Binkley, D., Moore, M.M., Romme, W.H., Brown, P.M., 2005. Was Aldo Leopold right about the Kaibab deer herd? Ecosystems 9, 1—16.

Borer, E.T., Seabloom, J.B., Shurnin, K.E., Anderson, C.A., Blanchetter, B., Halpern, B.S., 2005. What determines the strength of a trophic cascades? Ecology 86, 528—537.

Burke, C.J., 1973. The Kaibab deer incident: a long-persisting myth. BioScience 23, 113—114. Caughley, G., 1970. Eruption of ungulate populations, with emphasis on Himalayan tahr in New Zealand. Ecology 51, 53—72.

Côté, S.D., Rooney, T.P., Tremblay, J., Dussault, C., Waller, D.M., 2004. Ecological impacts of deer overabundance. Annual Review of Ecology, Evolution, and Systematics 35, 113—147.

Dixon, J.S., Sumner, E.L., 1939. The deer problem, deer trapping, and deer removal at Zion Canyon, Utah. In: Transactions of the 4th North American Wildlife Conference, February 13—15, 1939, Detroit, MI, pp. 231—236.

Estes, J.A., 1996. Predators and ecosystem management. Wildlife Society Bulletin 24, 390—396.

Fagergren, F.C., 1943. Memorandum for the Superintendent, report of deer reductions December 17, 1943, Zion National Park Archives, 4 p.

Folke, C., Carpenter, S., Walker, B., Scheffer, M., Elmqvist, T., Gunderson, L., Holling, C.S., 2004. Regime shifts, resilience, and biodiversity in ecosystem management. Annual Review of Ecology Evolution and Systematics 35, 557—581.

Hairston, N.G., Smith, F.E., Slobodkin, L.B., 1960. Community structure, population control, and competition. American Naturalist 94, 421—425.

Hebblewhite, M., White, C.A., Nietvelt, C.G., McKenzie, J.A., Hurd, T.E., Fryxell, J.M., Bayley, S.E., Paquet, P.C., 2005. Human activity mediates a trophic cascade caused by wolves. Ecology 86, 2135—2144.

Heyer, W.R., Donnelly, M.A., McDiarmid, R.W., Hayek, L.C., Foster, M.S. (Eds.), 1994. Measuring and Monitoring Biological Diversity: Standard Methods for Amphibians. Smithsonian Institution Press, Washington, DC, p. 64.

Holling, C.S., 1986. The resilience of terrestrial ecosystems: local surprise and global change. In: Clark, W.C., Minn, R.E. (Eds.), Sustainable Development of the Biosphere. Cambridge University Press, Cambridge, pp. 292—317.

Knight, T.M., McCoy, M.W., Chase, J.M., McCoy, K.A., Holt, R.D., 2005. Trophic cascades across ecosystems. Nature 437, 880—883.

Laliberte, A.S., Ripple, W.J., 2004. Range contractions of North American carnivores and ungulates. BioScience 54, 123—138.

Leopold, A., 1943. Deer irruptions. Wisconsin Academy of Sciences, Arts, and Letters 35, 351—366.

Leopold, A., Sowls, L.K., Spencer, D.L., 1947. A survey of overpopulated deer ranges in the United States. Journal of Wildlife Management 11, 162—183.

McLaren, B.E., Peterson, R.O., 1994. Wolves, moose and tree rings on Isle Royale. Science 266, 1555—1558.

McMahon, J.P., Moody, T., Apfelbaum, S.I., Lehnhardt, S.M., LaGesse, V., 2001. The potential for restoration along the Virgin River in Zion National Park. Grand Canyon Trust, St. George, Utah, Final Report, 57 p.

McShea, W.J., Rappole, J.H., 2000. Managing the abundance and diversity of breeding bird populations through manipulation of deer populations. Conservation Biology 14, 1161—1170.

Moorehead, B.B., 1976. Seasonal movements and abundance of mule deer (Odocoileus hemionus hemionus), in Zion National Park, Utah. Unpublished report, Utah State University, 56 p.

Morvilius, M.K., Fridell, R.A., Huebner, J.A., 2006. Virgin Spinedace (Lepidomeda mollispinis mollispinis) Population Monitoring Summary 1994—2005. Publication number 06-01, Utah Division of Wildlife Resources, Salt Lake City, Utah.

National Research Council, 2002. Riparian Areas: Functions and Strategies for Management. National Academy of Science, Washington, DC.

Pace, M.L., Cole, J.J., Carpenter, S.R., Kitchell, J.F., 1999. Trophic cascades revealed in diverse ecosystems. Trends in Ecology and Evolution 14, 483—488.

Polis, G.A., Sears, L.W., Huxel, D.R., Strong, J.M., 2000. When is a trophic cascades a trophic cascade? Trends in Ecology and Evolution 15, 473—475.

Presnall, C.C., 1938. A survey of the deer situation in Zion Canyon, Utah. Proceedings of the Utah Academy of Sciences, Arts, and Letters 15, 107—110.

Ray, J.C., Redford, K.H., Steneck, R.S., Berger, J. (Eds.), 2005. Large Carnivores and the Conservation of Biodiversity. Island Press, Washington, DC.

Reisewitz, S.E., Estes, J.A., Simenstad, C.A., 2006. Indirect food web interactions: sea otters and kelp forest fishes in the Aleutian archipelago. Oecologia 146, 623—631.

Ripple, W.J., Beschta, R.L., 2004. Wolves and the ecology of fear: can predation risk structure ecosystems? BioScience 54, 755—766.

Ripple, W.J., Beschta, R.L., 2005. Linking wolves and plants: Aldo Leopold on Trophic Cascades. BioScience 55, 613—621.

Ripple,W.J., Larsen, E.J., 2000. Historic aspen recruitment, elk, and wolves in northern Yellowstone National Park, USA. Biological Conservation 95, 361—370.

Rooney, T.P., Waller, D.M., 2003. Direct and indirect effects of white-tailed deer in forest ecosystems. Forest Ecology and Management 181, 165—176.

Scheffer, M., Carpenter, S.R., 2003. Catastrophic regime shifts in ecosystems: linking theory to observation. Trends in Ecology and Evolution 18, 648—656.

Schmitz, O.J., 2005. Scaling from plot experiments to landscapes: studying grasshoppers to inform forest ecosystem management. Oecologia 145, 225—234.

Schmitz, O.J., Kalies, E.L., Booth, M.G., 2006. Alternative dynamic regimes and trophic control of plant succession. Ecosystems 9, 659—672.

Shurin, J.B., Borer, E.T., Seabloom, E.W., Anderson, K., Blanchette, C.A., Broitman, B., Cooper, S.D., Halpern, B.S., 2002. A cross-ecosystem comparison of the strength of trophic cascades. Ecology Letters 5, 785—791.

Smith, C.J., 1943. Report of deer reduction program in Zion national Park. Unpublished report, Zion National Park Files, 12 p.

Smith, J.D., 2004. The role of riparian shrubs in preventing floodplain unraveling along the Clark Fork of the Columbia River in Deer Lodge Valley, Montana. In: Bennett, S.J., Simon, A. (Eds.), Riparian Vegetation and Fluvial Geomorpholgy, Water Science and Application, vol. 8. American Geophysical Union, Washington, DC, pp. 71—85.

Soulé, M.E., Estes, J.E., Berger, J., del Rio, C.M., 2003. Ecological effectiveness: conservation goals for interactive species. Conservation Biology 17, 1238—1250.

Soulé, M.E., Estes, J.A., Miller, B., Honnold, D.L., 2005. Strongly interacting species: conservation policy, management, and ethics. BioScience 55, 168—176.

Steens-Adams, M., 2002. Applying environmental history to restoration ecology: a case study from Zion National Park. Ecological Restoration 20, 252—261.

Stromberg, J., 1998. Dynamics of Fremont cottonwood (Populus fremontii) and saltcedar (Tamarix chinensis) populations along the San Pedro River, Arizona. Journal of Arid Environments 40, 133—135.

Terborgh, J., Estes, J.A., Paquet, P., Ralls, K., Boyd-Heigher, D., Miller, B.J., Noss, R.F., 1999. The role of top carnivores in regulating terrestrial ecosystems. In: Soulé, M., Terborgh, J. (Eds.), Continental Conservation: Scientific Foundations of Regional Reserve Networks. Island Press, Washington, DC, pp. 39—64.

Terborgh, J., Lopez, L., Nuñez, V.P., et al, 2001. Ecological meltdown in predator-free forest fragments. Science 294, 1923—1925.

Van Dyke, F.G., Brocke, R.H., Shaw, H.G., Ackerman, B.B., Hemker, T.P., Lindzey, F.G., 1986. Reactions of Mountain Lions to logging and human activities. Journal of Wildlife Management 50, 95—102.
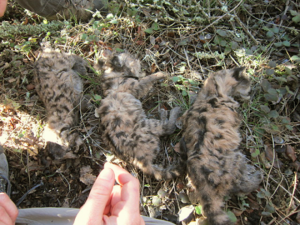
Puma 2 Jan 15 — Jughead

Puma 2 Jan 15 — Jughead

1/3/15 A 6-minute video by wildcatzoo
A southern California mountain lion referred to by researchers as Jughead is captured on a trail camera the same night coyotes came through. 20 minutes of video has been cut down to this 4 minute clip. Happy new year!

Oklahoma Wildlife Department Confirms Mountain Lion Sightings


Oklahoma Wildlife Department Confirms Mountain Lion Sightings

The following story was written by Ed Godfrey and first posted in the Oklahoman.State wildlife officials recently confirmed two mountain lion sightings in northeast Oklahoma.

Photos of the mountain lions were caught on two trail cameras, one in Pawnee County and one in Mayes County, both in late October.

The Oklahoma Department of Wildlife Conservation often receives reports and even photos of mountain lions in the state, but most of the time they are proven to be false or cannot be substantiated.

In these two cases, state wildlife officials investigated and determined the photos were authentic.

The last time before these photos that state wildlife officials confirmed a mountain lion sighting in Oklahoma was in 2011, when there were five [sightings].

State wildlife officials acknowledge there are mountain lions in the state but don’t know how many.

“We know they are uncommon,” said Micah Holmes, spokesman for the Wildlife Department.
Most cougars in the state are young males just passing through, Holmes said. There has been no documented reproduction of mountain lions in Oklahoma in decades, he said.

It is illegal to hunt mountain lions in Oklahoma, and it once was illegal to shoot the animal for any reason. In 2007, state law was changed where it became legal to kill a mountain lion if a person feared his or her life was in danger from a cat or that livestock was is in danger.

The law requires the cougar’s carcass be taken to the Wildlife Department for examination, but no one has ever submitted a dead mountain lion to state wildlife officials in the seven years since the law changed.

Trail camera photo of mountain lion.

Oklahoma Department of Wildlife Conservation: Confirmed on October 24, 2014 in Pawnee County. Trail cam photo of a mountain lion, sex unknown.

Trail camera photo of mountain lion.

Oklahoma Department of Wildlife Conservation: Confirmed on October 31, 2014 in Mayes County. Trail cam video, picture shown is a screen capture from the video of a mountain lion, sex unknown.

For more information on confirmed mountain lion sightings in Oklahoma, click here.

Little to Fear: Save Fear Itself

Little to Fear: Save Fear Itself

Man has always feared the unknown. Even now, with our dominion over nature many are frightened of wild creatures that might kill and eat humans. If you asked someone what animal frightens them the most, chances are sharks, wolves, and mountain lions will be near the top of their list.

It’s that fear, what some might even call irrational, that appears to fuel many of the management decisions of state game agencies, even though those same agencies claim to base their policies on science.

Take the Oregon Department of Fish and Wildlife (ODFW) for example. Despite never having a single recorded incident of a wild mountain lion attacking or killing a human in Oregon, ODFW carries out “public safety” hunts in an attempt to eradicate the mountain lion population in key areas of the state. Areas which don’t necessarily have the greatest number of humans and cougars mixed together, but where, based on the public outcries, the greatest fear abounds.

Throughout America, even in regions of the country where no known mountain lion population exists, reporters repeatedly interview distressed people who “fear for the safety of loved ones.” And it’s this deep-seated fear that’s stopping the natural reestablishment of mountain lions in the Midwest today.

Perhaps one of the most egregious examples of irrational fear came to our attention recently from the semi-rural community of Woodside, California. There, a fairly new resident to the area applied for a permit to construct a tunnel between two homes on the property. The reason they provided to the county planning commission for this addition was they wanted to provide safe passage for their children from mountain lions when they visited their grandparents on the other side of the family compound.

The Mountain Lion Foundation will be the first to admit that mountain lions are wild animals. However, by that same token, the category “wild animal” does not necessarily refer to a creature that’s automatically dangerous to, or targeting humans. It refers to a species that has not been domesticated–not specially bred and trained by humans for many generations and considered tame. As wild animals, mountain lions should be treated with a healthy dose of caution and respect, but not necessarily fear.

Consider these facts:

  • Mountain lions do not consider humans, as upright bi-peds, to be a food source. We simply do not fit their image of something good to eat.
  • Somewhere between 85 and 90 percent of all mountain lion sightings turn out to be false. So the chances of actually coming face to face with a mountain lion, especially in developed areas, are very slim.
  • To the best of our knowledge, in those incidents where a mountain lion has wandered into “our” territory, the animal is more concerned with getting away or hiding than in attacking someone.
  • Rural residents can reduce the chances of attracting mountain lions to their homes by taking the simple step of removing all potential food sources. That means don’t feed deer or other prey species, bring your pets indoor and secure small livestock, sheep, goats, and calves in covered enclosures at night.
  • Mountain lions can not afford to be injured in a fight. If confronted by a lion, making yourself appear large and threatening will usually make the mountain lion back off.

In the end, it all comes down to accepting that we don’t have to eliminate everything that might potentially harm us. With a little common sense, we and our loved ones can all stay safe while peacefully co-existing with America’s lions.

Fractured Genetic Connectivity Threatens a Southern California Puma Population

Research Article by Ernest HB, Vickers TW, Morrison SA, Buchalski MR, Boyce WM in PLOS ONE

Pumas in southern California live among a burgeoning human population of roughly 20 million people. To better understand how habitat loss, fragmentation, and human-caused puma mortality impact the puma population’s viability and genetic diversity, researchers have examined genetic status of pumas in coastal mountains within the Peninsular Ranges south of Los Angeles, in San Diego, Riverside, and Orange counties. These Santa Ana Mountains pumas show strong evidence of a genetic bottleneck and isolation from other populations in California. These and ecological findings provide a warning signal to wildlife managers and land use planners that mitigation efforts will be needed to stem further genetic and demographic decay in the Santa Ana Mountains puma population.
AbstractThumbnail of paper pdf. Click here to open.

Pumas (Puma concolor; also known as mountain lions and cougars) in southern California live among a burgeoning human population of roughly 20 million people. Yet little is known of the consequences of attendant habitat loss and fragmentation, and human-caused puma mortality to puma population viability and genetic diversity.

We examined genetic status of pumas in coastal mountains within the Peninsular Ranges south of Los Angeles, in San Diego, Riverside, and Orange counties. The Santa Ana Mountains are bounded by urbanization to the west, north, and east, and are separated from the eastern Peninsular Ranges to the southeast by a ten lane interstate highway (I-15). We analyzed DNA samples from 97 pumas sampled between 2001 and 2012. Genotypic data for forty-six microsatellite loci revealed that pumas sampled in the Santa Ana Mountains (n = 42) displayed lower genetic diversity than pumas from nearly every other region in California tested (n = 257), including those living in the Peninsular Ranges immediately to the east across I-15 (n = 55). Santa Ana Mountains pumas had high average pairwise relatedness, high individual internal relatedness, a low estimated effective population size, and strong evidence of a bottleneck and isolation from other populations in California.

These and ecological findings provide clear evidence that Santa Ana Mountains pumas have been experiencing genetic impacts related to barriers to gene flow, and are a warning signal to wildlife managers and land use planners that mitigation efforts will be needed to stem further genetic and demographic decay in the Santa Ana Mountains puma population.

Mountain lion walking past no hunting sign.
A well-placed trail camera photographs a lion walking in front of a “no hunting” sign. Photo courtesy of Winston Vickers, Wildlife Health Center’s Southern California Cougar Project.

Introduction

Genetic diversity, demography, and abundance — biological characteristics that influence population viability — can vary across a species’ distribution. Species that are generally perceived as wide-ranging and abundant are sometimes relegated to status as “least conservation concern”, in spite of indicators signaling concern and frequently, lack of data. Pumas (Puma concolor; also known as mountain lion, cougar, and in Florida, panther) epitomize this dilemma.

Although pumas in California have not been subjected to hunting since 1972, and were designated as a Specially Protected Mammal in 1990 [1], there is minimal active management and little scientifically validated data on statewide or regional population numbers. Pumas in southern California have one of the lowest annual survival rates among any population in North America, on par with rates seen in hunted populations (unpublished data). They are under increasing threats from habitat loss and fragmentation, and mortality from vehicle strikes, depredation permits, poaching, public safety kills, wildfire, and poisoning [2], [3]. Timely evaluation of potential threats to population viability is imperative in order to prioritize conservation activities to prevent collapse of some populations.

The human population of southern California is over 20 million [4] and expected to exceed 30 million by 2060 [5]. This increasing population will likely result in further loss, fragmentation, and degradation of natural habitats in the region. Habitat fragmentation south of greater Los Angeles has effectively turned the Santa Ana Mountain range in mostly Orange and Riverside counties into a ‘mega-fragment’ of habitat, surrounded to the west, north, and east by dense urban land uses. The only remaining montane and foothill habitat linkage connecting the Santa Ana Mountain range to other mountains of the Peninsular Range is a southeasterly swath of habitat bisected by a very heavily traveled 10-lane highway, Interstate 15 (I-15) (Figure 1).

FIGURE 1
Topographic map depicting location of Santa Ana Mountains, eastern Peninsular Ranges in southern California, and adjacent regions.
Topographic map depicting location of Santa Ana Mountains, eastern Peninsular Ranges in southern California, and adjacent regions. Inset shows location in the state of California.
Population viability of pumas in the Santa Ana Mountains (a geography henceforth referred to as distinct from the broader Peninsular Ranges to the east) has been of conservation concern for decades. Population monitoring and modeling in the 1980s highlighted that urbanization and highways were fragmenting puma habitat (e.g., [6], and that in turn motivated efforts to protect habitat connectivity in the region (e.g., [7], [8]). As part of a statewide assessment of puma genetic diversity and population structure, Ernest et al. [9] employed an 11-locus microsatellite panel and found that, for a limited sample size (n = 14) Santa Ana pumas had lower genetic diversity than other populations in California.

Since 2001, pumas in the region have been the subject of an ongoing study by the Karen C. Drayer Wildlife Health Center of the University of California, Davis (UCD) School of Veterinary Medicine. Visit the project’s website.

Photo of lion kitten in rocky den.
Photo courtesy of Winston Vickers, Wildlife Health Center’s Southern California Cougar Project.
Telemetry data from 74 pumas in the UCD study has confirmed that minimal connectivity (only one GPS-collared puma over ten years was documented to transit successfully; unpublished data) exists between the Santa Ana Mountains and the eastern Peninsular Ranges across I-15, confirming that previous connectivity concerns were warranted.

We conducted a detailed appraisal of the genetic diversity, relatedness, and population structure of southern California puma populations. Using 97 samples collected over 12 years as part of the UCD study, and a 46-locus microsatellite panel, we evaluated levels of genetic diversity, estimated effective population sizes and tested whether genetic data supported a hypothesis of recent bottleneck in the populations.

We assessed whether genetics reflected our telemetry observations of infrequent puma crossings of I-15 between the Santa Ana Mountains and the Peninsular Ranges to the east. Additionally we explored inter-population gene flow at multiple time scales by employing methods that reflect recent (a few generations) and more historical (tens or more generations).

Finally, we tested our hypothesis that the Santa Ana population had lower genetic diversity than those sampled from other regions in California.


Materials and Methods

Samples

We obtained blood or tissue samples for analysis of nuclear DNA from pumas captured for telemetry studies, and from those found dead or killed by state authorities for livestock depredation or public safety in San Diego, Orange, Riverside, and San Bernardino counties of southern California (n = 97) during 2001-2012 (Figure 2). Pumas captured for telemetry were captured and sampled as detailed in [10]. Forty-two samples were collected to the west of I-15 in the Santa Ana Mountains, and 55 samples were collected in the Peninsular Ranges to the east of I-15. A small number of additional samples were collected from deceased animals in San Bernardino County just to the north of the Peninsular Range across Interstate Highway 10. For population genetic comparisons with pumas sampled elsewhere throughout California, a 257 sample subset of our statewide puma DNA data archive was employed (regions and sample sizes detailed in Table 1 and depicted in Figure 1 in [9]).

FIGURE 2
Map of puma capture locations in the Santa Ana Mountains and eastern Peninsular Ranges of southern California.
Map of puma capture locations in the Santa Ana Mountains and eastern Peninsular Ranges of southern California. Colors of symbols represent genetic group assignment inferred from Bayesian clustering analysis (STRUCTURE analysis, see Figure 4). Genetic group A-1 = green diamonds; A-2 = red triangles (apex at top). One male puma (M86) captured in the Santa Ana Mountains had predominant genetic assignment to the A-2 (red) genetic group. Five individuals (light green squares) captured in the Santa Ana Mountains had partial assignment to the A-2 group (M91, F92, M93, M97 and F102). Molecular kinship analysis showed that M86 and a female (F89) captured in the Santa Ana Mountains were parents of pumas M91, F92, and M93 (captured in the Santa Ana Mountains). Puma M97 assigned in parentage to M86 and F61, while F102 had unknown parentage (no parentage assignments; due possibly to her death early in project prior to collection of most of the samples). Three individuals (orange triangles, apex at bottom), had partial assignment (however, less than 20%) to A-1.


TABLE 1
 Table 1. Genetic diversity summary statistics for southern California pumas (n = 97) relative to other populations in California (n = 257).
Genetic diversity summary statistics for southern California pumas (n = 97) relative to other populations in California (n = 257).


Ethics Statement

Animal handling was carried out in strict accordance with the recommendations and approved Protocol 10950/PHS, Animal Welfare Assurance number A3433-01, with capture and sampling procedures approved by the Animal Care and Use Committee at the University of California, Davis (Protocol #17233), and Memoranda of Understanding and Scientific Collecting Permits from the California Department of Fish and Wildlife (CDFW). Permits and permissions for access to conserved lands at puma capture and sampling sites were obtained from CDFW, California Department of Parks and Recreation, The Nature Conservancy, United States (US) Fish and Wildlife Service, US Forest Service, US Bureau of Land Management, US Navy/Marine Corps, Orange County Parks Department, San Diego County Parks Department, San Diego State University, Vista Irrigation District, Rancho Mission Viejo/San Juan Company, Sweetwater Authority, California Department of Transportation (CalTrans), and the City of San Diego Water Department.


DNA Extraction and Microsatellite DNA Data Collection

Whole genomic DNA was extracted using the DNeasy Blood & Tissue Kit (QIAGEN, Valencia, CA, USA). Fifty microsatellite DNA primers were initially screened for this project. Forty-six loci that performed well in multiplex PCR (using the QIAGEN Multiplex PCR kit; QIAGEN) and conformed to expectations for Hardy-Weinberg and linkage equilibria were selected for ultimate analysis [11], [12], [13]. One sex-identification locus (Amelogenin) was used to confirm sex in samples from degraded puma carcasses [14].

Photo of Vickers working on sedated lion.
Photo courtesy of Scott Vickers (ScottVickers.smugmug.com) and the Wildlife Health Center’s Southern California Cougar Project.
PCR products were separated with an ABI PRISM 3730 DNA Analyzer (Applied Biosystems Inc., Foster City, CA, USA) with each capillary containing 1 µL of a 1:10 dilution of PCR product and deionized water, 0.05 µL GeneScan-500 LIZ Size Standard and 9.95 µL of HiDi formamide (both products Applied Biosystems Inc.) that was denatured at 95°C for 3 min. Products were visualized with STRand version 2.3.69 [15]. Negative controls (all reagents except DNA) and positive controls (well-characterized puma DNA) were included with each PCR run. Samples were run in PCR at each locus at least twice to assure accuracy of genotype reads and minimize risk of non-amplifying alleles. For >90% samples, loci that were heterozygous were run at least twice and homozygous loci were run at least three times.


Genetic Diversity

The number of alleles (Na), allelic richness (AR; incorporates correction for sample size), observed heterozygosity (Ho), expected heterozygosity (He), Shannon’s information index [16], and tests for deviations from Hardy-Weinberg equilibrium were calculated using software GenAlEx version 6.5 [17], [18]. Shannon’s information index provides an alternative method of quantifying genetic diversity and incorporates allele numbers and frequencies. Testing for deviations from expectations of linkage equilibrium was conducted using Genepop 4.2.1 [19], and we tested for the presence of null alleles using the program ML RELATE [20]. We assessed significance for calculations at alpha = 0.05 and used sequential Bonferroni corrections for multiple tests [21] in tests for Hardy-Weinberg and linkage equilibria.

The average probability of identity (PID) was calculated two ways using GenAlEx: 1) assuming random mating (PIDRM) without close relatives in a population [22], and 2) assuming that siblings with similar genotypes occur in a population (PIDSIBS) [23]. Probability of identity is the likelihood that two individuals will have the same genetic profile (genotype) for the DNA markers used. PIDSIBS is considered conservative since it probably conveys a higher likelihood; however, we recognized that siblings occurred in these populations.


Assessing Population Structure and Genetic Isolation

We used a Bayesian genetic clustering algorithm (STRUCTURE version 2.3.4 [24], [25]) to determine the likely number of population groups (K; genetic clusters) and to probabilistically group individuals without using the known geographic location of sample collection. We used the population admixture model with a flat prior and assumed that allele frequencies were correlated among populations, and ran 50,000 Markov chain Monte Carlo repetitions following a burnin period of 10,000 repetitions. First, an analysis including 354 statewide puma genotypes (97 from southern California and 257 from other regions) was run to estimate the probability of one through 10 genetic clusters (K), with each run iterated three times.

Second, given the output of the statewide run, we ran an analysis using only the 97 southern California puma genotypes to estimate the probability of one through five K, with each run iterated three times. Employing STRUCTURE HARVESTER [26] we averaged log probability of the data given K, log Pr(X|K), statistics across the multiple runs for each of the K estimates. In each case (statewide and southern California), we selected the K value of highest probability by identifying the set of values where the log Pr(X|K) value was maximized and subsequently selected the minimum value for K that did not sacrifice explanatory ability [27], [28], [29]. We defined membership to a cluster based upon the highest proportion of ancestry to each inferred cluster.

Photo of lion with large cubs walking on trail at night.
Mountain lion F50 with her two cubs in September 2009. Photo courtesy of Winston Vickers, Wildlife Health Center’s Southern California Cougar Project.
To further assess and visualize genetic relationships among regions and individuals, we performed principal coordinates analyses (PCoA) via covariance matrices with data standardization [30] using GenAlEx. This is a technique that allowed us to explore and plot the major patterns within the data sets.

The PCoA process located major axes of variation within our multidimensional genotype data set. Because each successive axis explains proportionately less of the total genetic variation, the first two axes were used to reveal the major separation among individuals. Employing Genalex software, a pairwise, individual-by-individual genetic distance matrix was generated and then used to create the PCoA.

Wright’s F-statistic, FST, was calculated to appraise how genetic diversity was partitioned between populations. As implemented in GenAlEx, we used Nei’s [31] formula, with statistical testing options offered through 9999 random permutations and bootstraps.


Detecting Migrants

We used GENECLASS2 version 2.0.h [32] to identify first-generation migrants, i.e. individuals born in a population other than the one in which they were sampled. Genetic clusters identified during STRUCTURE analysis were treated as putative populations. GENECLASS2 provides different likelihood-based test statistics to identify migrant individuals, the efficacy of which depends on whether all potential source populations have been sampled. We first calculated the likelihood of finding a given individual in the population in which it was sampled, Lh, assuming all populations had not been sampled. We then calculated Lh/Lmax, the ratio of Lh to the greatest likelihood among the populations [33], which has greater power when all potential source populations have been sampled. The critical value of the test statistic (Lh or Lh/Lmax) was determined using the Bayesian approach of Rannala and Mountain [34] in combination with the resampling method of Paetkau et al. [33]; i.e., Monte Carlo simulations carried out on 10,000 individuals with the significance level set to 0.01.


Testing for Bottlenecks and Inferring Effective Population Size

We tested for evidence of recent population size reductions in Santa Ana Mountains and eastern Peninsular Range regions with one-tailed Wilcoxon sign-rank tests for heterozygote excess in the program BOTTLENECK version 1.2.02 [35]. The program evaluates whether the reduction of allele numbers occurred at a rate faster than reduction of heterozygosity, a characteristic of populations which have experienced a recent reduction of their effective population size (Ne) [35], [36]. This bottleneck genetic signature is detectable by this test for a finite time, estimated to be less than 4 times Ne generations [37]. These tests were performed using the two-phase (TPM, 70% step-wise mutation model and 30% IAM) model of microsatellite evolution and 10,000 iterations.

Photo of lion walking down grassy canyon.
Photo courtesy of Winston Vickers, Wildlife Health Center’s Southern California Cougar Project.

We then estimated contemporary Ne for each of the two regions based on gametic disequilibrium with sampling bias correction [38] using LDNE version 1.31 [39]. Ne is formally defined as the size of the ideal population that would experience the same amount of genetic drift as the observed population [40]. These analyses excluded alleles occurring at frequencies ≤0.05, and we used the jackknife method to determine 95% confidence intervals [38].


Relatedness Analyses: Pairwise Coefficient and Internal

Molecular kinship analysis was conducted using a number of software packages. Pairwise relatedness among individuals was evaluated using the algorithm of Lynch and Ritland [41], with reference allele frequencies calculated and relatedness values averaged within each southern California population, as implemented in GenAlEx. Partial molecular kinship reconstruction was conducted using a consensus of outputs from the GenAlEx pairwise relatedness calculator, ML Relate [20], CERVUS version 3.0.3 [42], and Colony version 2.0.3.1 [43], [44].

Individual genetic diversity (also called internal relatedness) was assessed using Rhh [45] as implemented in R statistical software [46]. This is a measure of genetic diversity within each individual (an estimate of parental relatedness [47], and we averaged over individuals for each of the two regions of southern California. Significance of differences between means was evaluated using t tests.


Results

Forty-two of the 46 loci that we employed were polymorphic in southern California and selected for the subsequent analyses. The average probabilities of identity with assumptions of either random mating (PIDRM) or mating among sibs (PIDSIBS) across the 42 loci for the eastern Peninsular Ranges were (PIDRM) 6.3×10⁻²² and (PIDSIBS) 3.1×10⁻¹⁰, and for the Santa Ana Mountains were (PIDRM) 2.8×10⁻¹⁵ and (PIDSIBS) 1.1×10⁻⁷ respectively. These very small values indicate that the panel of genetic markers provided very high resolution to distinguish individuals. For example, given this data the probability of seeing the same multi-locus genotype in more than one puma was less than one in nine million for Santa Ana Mountains pumas.


Genetic Diversity

Measures of genetic variation including allelic diversity, heterozygosity, Shannon’s information index, and polymorphism, were lower for Santa Ana pumas than most of those tested from other regions of California (Table 1). Such low genetic diversity indicators were approached only by pumas in the Santa Monica Mountains (Ventura and Los Angeles Counties), a neighboring remnant puma population in the north Los Angeles basin (Figure 1).


Population Structure

Bayesian clustering analysis (STRUCTURE; Figure 3 of statewide puma genetic profiles (n = 354), including 97 from southern California, also support genetic distinctiveness of Santa Ana Mountains and eastern Peninsular Range pumas from other populations in the state. Three main genetic groups (A, B, and C) were evident in the analysis (Figure 3) The 97 pumas sampled in southern California (right-hand set of bars in Figure 3, with samples from Santa Ana and eastern Peninsular Range pumas labeled) predominantly cluster within genetic group C. The Santa Ana pumas assign very tightly to group C (0.996 average probability assignment), while pumas of the eastern Peninsular Ranges showed more variable assignment (0.93 average probability assignment), with 9 individuals (16%) having less than 0.90 assignment. Pumas sampled in the Central Coast of California (which included Santa Monica Mountains pumas) make up the central set of bands, and those individuals predominantly assign to the genetic group B. Pumas sampled in the other regions of California (North Coast Ranges, Modoc Plateau, western Sierra Nevada, and eastern Sierra Nevada) predominantly cluster with the genetic group A. Notably, there are individuals sampled in each geographic area which cluster with a genetic group that is not the dominant one in that area, suggesting dispersal events and/or genetic exchange that have occurred to varying degrees in each region.

FIGURE 3
 California puma population genetic structure.
California puma population genetic structure. STRUCTURE bar plot displaying the genetic clustering relationship of southern California pumas relative to others in California. Three major genetic groups, A (blue, on right), B (brown, in center), and C (yellow, on left), are evident for analysis of 354 individuals sampled throughout California. Abbreviations: NC = North Coast, MP-ESN = Modoc Plateau & Eastern Sierra Nevada, WSN = Western Sierra Nevada, CC-N = Central Coast: north, CC-C = Central Coast: central, CC-S = Central Coast: South (Santa Monica Mountains), PR-E = Peninsular Range-East, SAM = Santa Ana Mountains. The plot is organized by grouping individuals in order of their geographic region sampling source. Proportional genetic assignment for each puma is represented by a vertical bar, most easily visualized for pumas that genetically assigned to a group different from most others sampled in its region (for example one individual with over 80% brown and 8% blue near far left of group A). Pumas primarily from the Sierra Nevada Range and northern California are represented by group A (yellow), group B (brown) includes primarily Central Coast pumas and group C (blue) represents primarily southern California pumas (Santa Ana Mountains and eastern Peninsular Ranges).


A STRUCTURE analysis focused only on genetic data from the 97 southern California pumas indicated two distinct genetic groups (C-1 and C-2 shown in Figure 4). Pumas sampled in the eastern Peninsular Range region east of I-15 group primarily with C-2 and those of the Santa Ana Mountain region on the west side of I-15 group with C-1. An exception to the consistent genetic clustering was an adult male (M) puma (M86), that was captured in the Santa Ana Mountains but clustered with pumas from the eastern Peninsular Ranges (primarily genetic group C-2). Five other pumas captured in the Santa Ana Mountains had a 30-50% assignment to the C-2 group (M91, F92, M93, M97 and F102). Molecular kinship analysis showed that M86 and a female (F89) captured in the Santa Ana Mountains and assigned to the C-1 genetic group were the likely parents of three of these pumas (M91, F92, and M93) (results of relatedness and kinship analyses). M86 also was the likely parent of another puma in the group (M97), an offspring of another female (F61) that was sampled in Santa Ana Mountains and clustered with the C-1 genetic group. F102 was a <1 year old female killed by a vehicle in 2003 prior to collection of the majority of samples from adults in the Santa Ana Mountains.

FIGURE 4
 Southern California puma population genetic structure.
Southern California puma population genetic structure. Bar Plot displaying results of STRUCTURE analysis focused on genotypic data from 97 southern California pumas (the blue block from Figure 3). With removal of the strong genetic signal from northern California and Central Coast samples (see Figure 3), two distinct southern California groupings were inferred, C-1 (green, on right) and C-2 (red, on left). These reflect the two regions: Santa Ana Mountains to the west of I-15 (predominantly genetic group C-1) and eastern Peninsular Ranges to the east of I-15 (predominantly genetic group C-2). Genetic clustering is dependent on genetic variance among samples included in the analysis. One male puma (M86) captured in the Santa Ana Mountains has predominant genetic assignment to the C-2 (red) genetic group (the predominant genetic cluster for PR-E), and five others had partial assignment to the C-2 group (M91, F92, M93, M97 and F102). Molecular kinship analysis showed that M86 and a female (F89) assigning to the C-1 genetic group were parents of pumas M91, F92, and M93 (all were captured in the Santa Ana Mountains).

Principal coordinates analysis of statewide puma genetic profiles (n = 354) (PCoA; Figure 5) allowed graphical examination of the first two major axes of multivariate genetic variation, and confirmed and added detail to the genetic distinctiveness of southern California pumas relative to others in California. The PCoA also reinforced the distinctiveness of pumas sampled in the Santa Ana Mountains from those sampled in the eastern Peninsular Ranges. Most pumas sampled in the Santa Ana Mountains align in a cloud of data points distinct from the eastern Peninsular Range pumas, and were the most genetically distant from all other pumas tested in California (Figure 5). The analysis also confirms the STRUCTURE findings that M86 who was sampled in the Santa Ana Mountains genetically aligns with the pumas sampled in the Peninsular Ranges, as does one of his offspring, M93 (see Figure 6 for additional detail). The PCoA position of data points for three pumas sampled in the San Bernardino Mountains north of Peninsular Ranges (pink diamonds in Figure 5) illustrates an intermediate genetic relationship between pumas from the rest of California and pumas sampled in the eastern Peninsular Ranges and Santa Ana Mountains, and suggests that they may represent transitional gene flow signature between southern California and regions to the north and east.

FIGURE 5
 Principal Coordinates analyses (PCoA) constructed using genetic covariance matrices (GenAlEx) for 354 California puma genetic profiles including 97 from southern California.
Principal Coordinates analyses (PCoA) constructed using genetic covariance matrices (GenAlEx) for 354 California puma genetic profiles including 97 from southern California. Patterns displayed for first two axes of variation within the genetic data set. Each point, color-coded to its sampling region, represents an individual puma. Note that colors in PCoA diagrams reflect geographic source of samples and not STRUCTURE genetic cluster assignment. Abbreviations and sample sizes per Table 1. Arrows denote pumas described in Figure 4


FIGURE 6
 Principal Coordinates analyses (PCoA) via covariance matrices for 97 southern California puma genetic profiles as conducted in GenAlEx.
Principal Coordinates analyses (PCoA) via covariance matrices for 97 southern California puma genetic profiles as conducted in GenAlEx. Patterns displayed for first two axes of variation within the genetic data set. Each point represents an individual puma, and has sample identification number and color-coding to sampling region. Note that colors in PCoA diagrams reflect geographic source of samples and not STRUCTURE genetic cluster assignment. Abbreviations and sample sizes per Table 1.

PCoA analysis of only the samples collected in the Santa Ana and Peninsular Ranges (Figure 6) confirms the findings from the STRUCTURE analysis indicating genetic distinctiveness of these two populations despite geographic proximity. Siblings M91, F92, and M93 (offspring of F89 and M86 according to our kinship reconstructions) as well as M97 (likely offspring of a female puma captured in the Santa Ana Mountains, F61, and M86, according to kinship reconstructions) are located graphically midway between their parents’ PCoA locations.


Genetic Isolation

Wright’s FST calculations (Table 2) indicate that Santa Ana Mountains pumas are the most isolated of those tested throughout California (p = 0.0001). Despite the short distance (as short as the distance across the I-15 Freeway) between the Santa Ana Mountains and the eastern Peninsular Range region, FST was surprisingly high (0.07) given the very close proximity of the two regions (separated only by an interstate highway). The Santa Monica Mountains pumas and Santa Ana Mountains pumas had the highest FST (0.27; lowest gene flow) of all pairwise comparisons in the state, demonstrating a high level of genetic isolation between these regions. The Santa Monica Mountains and Santa Ana Mountains are less than 100 km direct distance apart, through the center of Los Angeles. However the more likely distance for puma travel between these two mountain ranges, avoiding urban areas and maximizing upland habitat, would likely exceed 300 km (estimated using coarse measurements on Google Earth, Google, Inc.).

TABLE 2
 Wright's FST values indicate that southern California mountain lion populations are genetically distinct from other populations in California.
Wright’s FST values indicate that southern California mountain lion populations are genetically distinct from other populations in California.

Detection of Migrants

GENECLASS2 identified four individuals as first-generation migrants (P<0.01), four with the Lh method (pumas F75, M80, M86, and M99), and one with the Lh/Lmax ratio (M86, which was detected using both likelihood methods). Pumas F75, M80, and M99 were all captured from the San Bernardino Mountains (Figure 2) at the northern extent of the study region, yet clustered with individuals from the Eastern Peninsular Range during STRUCTURE analysis. Their migrant designation may suggest immigration from populations north of Los Angeles and/or a distinct genetic population within the San Bernardino region. Puma M86 was captured in the Santa Ana Mountains, but assigned strongly to the eastern Peninsular Range genetic cluster, indicating a seemingly clear population of origin. This individual assignment is in accord with the clustering results from STRUCTURE (Figure 4).


Evidence of Genetic Bottlenecks

The Santa Ana Mountains population exhibited clear evidence of a population bottleneck (Table 3; Wilcoxon sign-rank test for heterozygote excess, and detection of a shift in the allele frequency distribution mode [36]; BOTTLENECK software). The eastern Peninsular Range mountain lions did not show a strong signature of a bottleneck.

TABLE 3
 Effective population size estimations and indications of recent genetic bottlenecks in southern California pumas.
Effective population size estimations and indications of recent genetic bottlenecks in southern California pumas.


Effective Population Size

Effective population size (Ne) estimations using the linkage disequilibrium method (LDNe program) were 5.1 for the Santa Ana Mountains population and 24.3 for mountain lions in the eastern Peninsular Ranges. Statistical confidence intervals for both regions, given the genetic data, were tight (Table 3).


Relatedness: Pairwise Coefficient and Internal

The average pairwise coefficient of relatedness (r, Figure 7) was highest in Santa Ana Mountains pumas relative to all others tested in California (0.22; 95% confidence interval of 0.22-0.23), a level that approaches second order kinship relatedness (half-sibs, grantparent/grandchild, aunt-niece, etc). The value for the eastern Peninsular Ranges was 0.10 (confidence interval of 0.09-0.10), less than that of third order relatives (first cousins, great-grandparent/great grandchild). Other regions of California averaged similar or lower values to those of eastern Peninsular Ranges (Figure 7).

FIGURE 7
 Average pairwise relatedness (r; blue bars with confidence intervals) for pumas sampled in southern California relative to other regions in California. Algorithm of Lynch and Ritland (1999) as implemented in GenAlEx.
Average pairwise relatedness (r; blue bars with confidence intervals) for pumas sampled in southern California relative to other regions in California. Algorithm of Lynch and Ritland (1999) as implemented in GenAlEx. Expected range for “unrelated” is shown as red bars with confidence intervals. The average relatedness of Santa Ana Mountain pumas is higher than those sampled in Peninsular Ranges east of I-15 and for any other region tested in California. Relatedness in the Santa Ana Mountains pumas approaches second order family relationship (half sibs, niece-aunt, grandparent-grandchild, etc.). Abbreviations listed in Table 1.

Among pumas sampled in the Santa Ana Mountains, the population average (0.14) for internal relatedness as implemented in rHH software was significantly higher (t test; p = 5.8×10⁻⁶) than for those sampled in the eastern Peninsular Ranges (0.001). Of a group of six pumas which clustered near one another in PCoA (Figure 6), five have among the lowest individual genetic diversity measured in southern California (Puma ID [Internal Relatedness value: F45 [0.37], F51 [0.37], M87 [0.28], F90 [0.21], F95 [0.38], and M96 [0.33]). Notably, pumas F95 and M96 (highest internal relatedness) were observed with kinked tails at capture in the Santa Ana Mountains (Figure 8).

FIGURE 8
 Photographs of kinked tails of pumas F95 (a) and M96 (b).
Photographs of kinked tails of pumas F95 (a) and M96 (b). Arrows indicate kink sites. Puma F95 had tail kink at base of tail and Puma M96 had tail kink near distal tip of tail. These two pumas had among the lowest genetic diversity measured in this study.


Discussion

Pumas of the Santa Ana Mountains are genetically depauperate, isolated, and display signs of a recent and significant bottleneck. In general, coastal California puma populations have less genetic diversity and less gene flow from other populations than those farther inland [9] (Table 1). This study showed that two coastal populations (Santa Ana Mountains and Santa Monica Mountains) had particularly low genetic variation and gene flow from other regions. Lack of gene flow is likely due in part to natural barriers to puma movement: geography and habitat (Pacific Ocean to the west; less hospitable desert habitat bounding certain regions, etc.). However, our data suggest that anthropogenic developments on the landscape are playing a large role in genetic decay in the Santa Ana Mountains puma population. As large solitary carnivores with sizable habitat requirements, pumas are extremely sensitive to habitat loss and fragmentation [48], [49].

The genetic bottleneck in the Santa Ana Mountains pumas is estimated at less than about 80 years, depending on definitions of effective population size (Ne) and puma generation time. Luikhart and Cornuet [37] state that the bottleneck signatures decay after “4 times Ne [here estimated to be 5.1] generations”. Logan and Sweanor [50] estimated generation time for their New Mexico population of pumas to be 29 months (2.4 years) for females. If an allowance of 2.4-4.0 years is made for generation times (unknown) in the Santa Ana Mountains population, the maximum estimated time since a bottleneck would be about 40-80 years. This was a period of tremendous urban development and multi-lane highway construction in southern California, particularly I-15 [51]. It is likely that the potential for connectivity between the Santa Ana Mountains and the Peninsular Range-East region will continue to be eroded by ongoing increases in traffic volumes on I-15, and conversion of unconserved lands along the I-15 corridor by development and agriculture [8], [48], [52].

An isolated population of pumas in the Santa Monica Mountains to the north of the Santa Ana Mountains also exhibit low values relative to other western North American populations (see Table 2 in [53]. Santa Monica pumas are isolated by urbanization of a megacity and busy wide freeways (Ventura county, including greater Los Angeles region [53]. Multiple instances of intraspecific predation, multiple consanguineous matings (father to daughter, etc.), and lack of successful dispersal highlight a suite of anthropogenic processes also occurring in the Santa Ana Mountains. Our collective findings of kinked tails and very low genetic diversity in Santa Ana pumas F95 and M96 may portend manifestations of genetic inbreeding depression similar to those seen in Florida panthers [54], [55]; however recognizing that kinked tails can have non-genetic etiologies.

Photo of lion over two juveniles eating deer.
The daughter of M86, known as F92 with her two cubs. Photo courtesy of Winston Vickers, Wildlife Health Center’s Southern California Cougar Project.

Our analyses suggest that the Santa Ana Mountains puma population is highly challenged in terms of genetic connectivity and genetic diversity, a result hinted at in Ernest et al. [9] and now confirmed to be an ongoing negative process for this population. This compounds the demographic challenges of low survival rates and scant evidence of physical connectivity to the Peninsular Ranges east of I-15 (unpublished data). Beier [6] documented these same challenges during the 1990’s, and data from the ongoing UCD study suggest the trends have accelerated. Substantial habitat loss and fragmentation has occurred and is continuing to occur; Burdett et al. [10] estimated that by 2030, approximately 17% of puma habitat that was still available in 1970 in southern California will have been lost to development, and fragmentation will have rendered the remainder more hazardous for pumas to utilize. Riley et al [53] document a natural “genetic rescue” event: the 2009 immigration and subsequent breeding success of a single male to the Santa Monica Mountains. This introduction of new genetic material into the population was paramount to raising the critically low level of genetic diversity, as also exemplified by the human-mediated genetic augmentation of Florida Panthers with Texas puma stock [56].

These findings raise concerns about the current status of the Santa Ana Mountains puma population, and the longer-term outlook for pumas across southern California. In particular, they highlight the urgency to maintain — and enhance — what connectivity remains for pumas (and presumably numerous other species) across I-15. Despite warnings [6], [9] about potential serious impacts to the Santa Ana Mountains puma population if concerted conservation action was not taken, habitat connectivity to the Peninsular Ranges has continued to erode. We are hopeful that these new genetic results will motivate greater focus on connectivity conservation in this region. Indeed, the Santa Ana Mountains pumas may well serve as harbingers of potential consequences throughout California and the western United States if more attention is not paid to maintaining connectivity for wildlife as development progresses.

Acknowledgments

Samples, data, and expertise were provided by multiple people and agencies, including California Department of Fish and Wildlife (R. Botta, B Gonzales, M. Kenyon, P. Swift, S. Torres, D. Updike, and others), California State Parks, National Park Service, The Nature Conservancy, UC Davis Wildlife Health Center, UC Davis Veterinary Genetics Laboratory, and the US Geological Survey. We thank the following for their technical assistance: L. Dalbeck, T. Drazenovich, T. Gilliland, J. George, and M. Plancarte. GIS data management and project cartography was provided by B. Cohen and J. Sanchez. Field work assistance was provided by J. Bauer, C. Bell, P. Bryant, D. Dawn, M. Ehlbroch, D. Krucki, K. Logan, B. Martin, B. Millsap, M. Puzzo, D. Sforza, L. Sweanor, C. Wiley, E. York, and numerous volunteers. Thanks to E. Boydsen, K. Crooks, R. Fisher, and L. Lyren for assistance coordinating field projects and sample acquisition. We thank anonymous reviewers for their constructive comments.

Author Contributions

Conceived and designed the experiments: HBE TWV WMB. Performed the experiments: HBE TWV MRB WMB. Analyzed the data: HBE TWV MRB. Contributed reagents/materials/analysis tools: HBE TWV SAM WMB. Contributed to the writing of the manuscript: HBE TWV SAM MRB WMB.

References

1. Mansfield TM, Torres SG (1994) Trends in mountain lion depredation and public safety threats in California. Paper 33. Proceedings of the Sixteenth Vertebrate Pest Conference, Santa Clara, CA. Editors: WS Halverson and AC Crabb. University of California, Davis.

2. Riley SPD, Pollinger JP, Sauvajot RM, York EC, Bromley C, et al. (2006) FAST-TRACK: A southern California freeway is a physical and social barrier to gene flow in carnivores. Mol Ecol 15: 1733-1741.

3. Riley SPD, Bromley C, Poppenga RH, Uzal FA, White L, et al. (2007) Anticoagulant exposure and notoedric mange in Bobcats and Mountain Lions in urban Southern California. J Wildl Manage 71: 1874-1884.

4. U.S. Census Bureau (2012) 2010 Census of Population and Housing, Summary Population and Housing Characteristics, CPH-1-6, California, U.S. Government Printing Office, Washington, DC.

5. California Department of Finance (2013) New Population Projections: California to surpass 50 million in 2049. Press release. Available: http://www.dof.ca.gov/research/demographic/reports/projections/p-1/documents/Projections_Press_Release_2010-2060.pdf Accessed 2 December 2013.

6. Beier P (1995) Dispersal of juvenile cougars in fragmented habitat. J Wildl Manage 59: 228-237.

7. Luke C, Penrod K, Cabanero CR, Beier P, Spencer W, et al. (2004) A Linkage Design for the Santa Ana-Palomar Mountains Connection. Unpublished report. San Diego State University, Field Station Programs and South Coast Wildlands. Available at: http://www.scwildlands.org/reports/SCML_SantaAna_Palomar.pdf.

8. Morrison SA, Boyce WM (2009) Conserving connectivity: Some lessons from mountain lions in southern California. Conserv Biol 23: 275-285.

9. Ernest HB, Boyce WM, Bleich VC, May B, Stiver SJ, et al. (2003) Genetic structure of mountain lion (Puma concolor) populations in California. Conserv Genet 4: 353-366.

10. Burdett CL, Crooks KR, Theobald DM, Wilson KR, Boydston EE, et al. (2010) Interfacing models of wildlife habitat and human development to predict the future distribution of puma habitat. Ecosphere 1: 1.

11. Ernest HB, Penedo MCT, May BP, Syvanen M, Boyce WM (2000) Molecular tracking of mountain lions in the Yosemite Valley region in California: genetic analysis using microsatellites and faecal DNA. Mol Ecol 9: 433-441.

12. Kurushima JD, Collins JA, Well JA, Ernest HB (2006) Development of 21 microsatellite loci for puma (Puma concolor) ecology and forensics. Mol Ecol Notes 6: 1260-1262.

13. Menotti-Raymond M, David VA, Lyons LA, Schaffer AA, Tomlin JF, et al. (1999) A genetic linkage map of Microsatellites of the domestic cat (Felis catus). Genomics 57: 9-23.

14. Pilgrim KL, Mckelvey KS, Riddle AE, Schwartz MK (2005) Felid sex identification based on noninvasive genetic samples. Mol Ecol Notes 5: 60-61. doi: 10.1111/j.1471-8286.2004.00831.x 15. Toonen RJ, Hughes S (2001) Increased throughput for fragment analysis on an ABI Prism 377 automated sequencer using a membrane comb and STRAND software. BioTechniques 31: 1320-1324.

16. Sherwin WB, Jabot F, Rush R, Rossetto M (2006) Measurement of biological information with applications from genes to landscapes. Mol Ecol 15: 2857-2869.

17. Peakall R, Smouse PE (2006) GenAlEx 6: genetic analysis in Excel. Population genetic software for teaching and research. Mol Ecol Notes 6, 288-295.

18. Peakall R, Smouse PE (2012) GenAlEx 6.5: genetic analysis in Excel. Population genetic software for teaching and research – an update. Bioinformatics 28: 2537-2539.

19. Rousset F (2008) genepop’007: a complete re-implementation of the genepop software for Windows and Linux. Mol Ecol Resour 8: 1755-0998.

20. Kalinowski ST, Wagner AP, Taper ML (2006) ML-RELATE: a computer program for maximum likelihood estimation of relatedness and relationship. Mol Ecol 6: 576-579.

21. Rice WR 1989. Analysing tables of statistical tests. Evolution 43: 223-5.

22. Taberlet P, Luikart G (1999) Non-invasive genetic sampling and individual identification. Biol J Linn Soc 68: 41-55.

23. Waits LP, Luikart G, Taberlet P (2001) Estimating the probability of identity among genotypes in natural populations: cautions and guidelines. Mol Ecol 10: 249-56.

24. Pritchard JK, Stephens M, Donnelly P (2000) Inference of population structure using multilocus genotype data. G3 155: 945-959.

25. Hubisz MJ, Falush D, Stephens M, Pritchard J (2009) Inferring weak population structure with the assistance of sample group information. Mol Ecol Resour 9: 1322-1332.

26. Earl DA, vonHoldt BM (2012) STRUCTURE HARVESTER: a website and program for visualizing STRUCTURE output and implementing the Evanno method. Conserv Genet Resour 4: 359-361.

27. Pritchard JK, Wen W (2002) Documentation for structure version 2.3.4. As viewed June 1 2013: http://pritch.bsd.uchicago.edu.

28. Evanno G, Regnaut S, Goudet J (2005) Detecting the number of clusters of individuals using the software STRUCTURE: a simulation study. Mol Ecol 14: 2611-2620.

29. Waples RS, Gaggiotti O (2006) What is a population? An empirical evaluation of some genetic methods for identifying the number of gene pools and their degree of connectivity. Mol Ecol 15, 1419-1439.

30. Orloci L (1978) Multivariate analysis in vegetation research. 2nd ed. Dr W. Junk. The Hague. 451 p.

31. Nei M (1977) F-statistics and analysis of gene diversity in subdivided populations. Ann Hum Genet 41: 225-233.

32. Piry S, Alapetite A, Cornuet JM, Paetkau D, Baudouin L (2004) GENECLASS2: A software for genetic assignment and first-generation migrant detection. J Hered 95: 536-539.

33. Paetkau D, Slade R, Burdens M, Estoup A (2004) Genetic assignment methods for the direct, real-time estimation of migration rate: a simulation-based exploration of accuracy and power. Mol Ecol 13: 55-65.

34. Rannala B, Mountain JL (1997) Detecting immigration by using multilocus genotypes. Proc Natl Acad Sci USA 94: 9197-9201.

35. Cornuet JM, Luikart G (1997) Description and power analysis of two tests for detecting recent population bottlenecks from allele frequency data. G3 144: 2001-2014.

36. Luikart G, Allendorf FW, Cornuet JM, Sherwin WB (1998) Distortion of allele frequency distributions provides a test for recent population bottlenecks. J Hered 89: 238-247.

37. Luikart G, Cornuet JM (1998) Empirical evaluation of a test for identifying recently bottlenecked populations from allele frequency data. Conserv Biol 12: 228-237.

38. Waples RS (2006) A bias correction for estimates of effective population size based on linkage disequilibrium at unlinked gene loci. Conserv Genet 7: 167-184.

39. Waples RS, Do C (2008) LDNE: a program for estimating effective population size from data on linkage disequilibrium. Mol Ecol Resour 8: 753-756.

40. Wright S (1969) Evolution and the Genetics of Population. Vol 2. The Theory of Gene Frequencies. University of Chicago Press.

41. Lynch M, Ritland K (1999) Estimation of pairwise relatedness with molecular markers. G3 152: 1753-1766.

42. Kalinowski ST, Taper ML, Marshall TC (2007) Revising how the computer program CERVUS accommodates genotyping error increases success in paternity assignment. Mol Ecol 16: 1099-1006.

43. Jones OR, Wang J (2010) COLONY: a program for parentage and sibship inference from multilocus genotype data. Mol Ecol Resour 10: 551-555.

44. Wang J (2012) Computationally efficient sibship and parentage assignment from multilocus marker data. G3 191: 183-194.

45. Alho JS, Välimäki K, Merilä J (2010) Rhh: an R extension for estimating Multilocus heterozygosity and heterozygosity-heterozygosity correlation. Mol Ecol Resour 10: 720-72.

46. R Development Core Team (2011) R: A language and environment for statistical computing. R Foundation for Statistical Computing, Vienna, Austria.

47. Amos W, Worthington Wilmer J, Fullard K, Burg TM, Croxall JP (2001) The influence of parental relatedness on reproductive success. Proc R Soc Lond B Biol Sci 268: 2021-2027.

48. Beier P (1993) Determining Minimum Habitat Areas and Habitat Corridors for Cougars. Conserv Biol 7: 94-108.

49. Crooks KR (2002) Relative Sensitivities of Mammalian Carnivores to Habitat Fragmentation. Conserv Biol 16: 488-502.

50. Logan K and Sweanor L (2001) Desert Puma: Evolutionary Ecology And Conservation Of An Enduring Carnivore. Island Press. 464.

51. Barbour E (2002) Metropolitan growth planning in California, 1900-2000. Public Policy Institute of California. San Francisco, California. 246.

52. Beier P (1996) Metapopulation modeling, tenacious tracking, and cougar conservation. In McCullough DR, editor, Metapopulations and wildlife management. Washington DC: Island Press. 293-323.

53. Riley SPD, Serieys LEK, Pollinger J, Sikich J, Dalbeck L, et al. Individual behaviors dominate the dynamics of an urban mountain lion population isolated by roads. Curr Biol 24: 1989-1994.

54. Roelke ME, Martenson JS, O’Brien SJ (1993) The consequences of demographic reduction in the endangered Florida panther. Curr Biol 3: 340-350.

55. Culver M, Hedrick PW, Murphy K, O’Brien S Hornocker MG (2008) Estimation of the bottleneck size in Florida panthers. Anim Conserv 11: 104-110.

56. Johnson WE, Onorato DP, Roelke ME, Land ED, Cunningham M, et al. (2010). Genetic restoration of the Florida panther. Science 329, 1641-1645.


This article is available for free thanks to PLOS ONE’s open access policy.

First Mountain Lion Sighting in Kansas Since 2012


First Mountain Lion Sighting in Kansas Since 2012

For the first time in almost two years, the Kansas Department of Wildlife, Parks and Tourism (KDWPT) has verified the presence of a mountain lion in that state.The sighting resulted from a trail camera photograph taken in Labette County, located in the Southeast corner of Kansas. When notified of the event KDWPT staff visited the area and confirmed the photograph’s authenticity.

KDWPT investigates all mountain lion sightings to determine their validity whenever evidence, such as tracks, a cached kill or a photograph exists. KDWPT Biologists assume that most sightings are of transient young males, coming from established populations in nearby states.

“It’s not uncommon for young males to travel great distances looking for home ranges,” said Matt Peek, KDWPT furbearer biologist. “So far, these animals appear to be passing through, rather than staying and establishing home ranges in Kansas.”

Kansas’ indigenous mountain population was originally eradicated by humans in 1904. In 2007, the first mountain lion known to have returned to that state was killed by a deer hunter in Barber County. This particular lion sighting is the 10th verified by KDWPT since that 2007 killing.

Photo of lion in Kansas field.

Mountain lion confirmed in Labette County, southeast Kansas.

California Dreamland: Golden Gate Neighbors

California Dreamland: Golden Gate Neighbors

Guest Commentary by Christopher Spatz, President of the Cougar Rewilding Foundation

Chris Spatz discusses a recent trip to Pacifica, California and how attitudes towards mountain lions differ from his home state of New York where officials are opposed to the species’ recovery. Midwestern states with tiny populations of lions continue their intolerance, and most western states needlessly slaughter hundreds of lions each year for recreation. Citizens of California were the first to grant Puma concolor the freedom to teach humans the limits of their habitat, to determine how close mountain lions wish to live near us, to let them be neighbors.

“Sometimes at dusk I sit on my desk and watch sunset-streaked clouds fade away toward Paddy Mountain (where one of the last VA cougars was shot). I wonder how it would be to know a panther crouches there again, yellow eyes gleaming, muscles taut, utterly focused. How it would be to accept the risks with understanding and respect, in return for the rightness. A dank breeze slides down Cross Mountain and a chill rises up my back. It would feel, I think, like freedom.


Pacifica, California — Mary Dare has lived in Pacifica since 1977. Raised her children here. Retired here. Each morning she walks the trails and parks of this town of 38,000 tucked between the Pacific Ocean and Sweeney Ridge, the northern tongue of the Santa Cruz Mountains, five miles south of the San Francisco city line: the end of what might be called contiguous open space before urban build-out across the northern peninsula. San Francisco International Airport is three crow-fly miles due east. This is no one’s idea of wilderness.

Three-quarters of residential Pacifica is surrounded by posted mountain lion habitat:

San Pedro Valley County Park, Pacifica: Please Protect Them By Protecting Yourself.

At 7 AM on this classic, misty coast morning, Mary is finishing her walk on a loop in San Pedro Valley County Park. Trails switchback steeply up through dense underbrush and stands of eucalyptus. The weekend rain finds Steelhead trout pushing from the ocean up the swollen creek to their ancestral spawning grounds in the park.

Every one of the dozen people I see this early appears to be well north of Medicare eligibility. A group of three. Most are walking solo (dog walking is not permitted in the park), exchanging greetings as they pass one another — a solitary constitutional not recommended in mountain lion habitat. But a random sample of walkers finds little concern. Yes, they know the cats are here, find their pug-marks and scat and deerkills, even see them from time-to-time, as Mary did one morning, a muscled apparition skirting the edge of the very field we’re standing in. And like the suburban residents of northern New Jersey, who now share their suburbs with 800 lb black bears, the retired residents of Pacifica have taken living with a big predator in stride.

LEFT: Mary Dare solo in cat habitat. CENTER: Mary and neighbors. RIGHT: No Dog Zone, cat scat and cell phone in foreground.

When CRF Vice President John Laundré last year published his peer-reveiwed cougar habitat analysis for the Adirondacks, it was met with skepticism, criticism even, by biologists who said John’s conclusion, that the 6 million acres of Adirondack Park, the largest protected hunk of land in the Lower 48, could support as many as 350 cougars. “Dreamland,” one retired NY biologist called the conclusion. Sure, said the biologist, cougars lived near towns out west, but the bulk of their habitat existed in great blocks of mountainous refuge, far from people, “In contrast,” he said, “there’s people spread all throughout the Adirondacks.” In dreamland, I’m finding, there are mountain lions spread throughout the Bay Region’s 7.5 million people.

The next day, an hour down the peninsula, I’m headed north with Paul Houghtaling and Veronica Yovovich, biologists from the UC Santa Cruz Puma Project, along blessedly sunny (missing back-to-back Northeast winter storms) Rt. 17. The four-lane highway bisects the southern Santa Cruz Mountains, running between Silicon Valley 20 miles south to the coastal city of Santa Cruz. Mountain lions routinely navigate Rt. 17, though the highway and its Jersey barriers remain a major obstacle to cougar life and limb. Scrappy Veronica (she’s also worked with wolves, and rock climbs) has crawled into culverts under Rt. 17 trying to determine if the cats might be using them as crossings. The team’s not sure.

Veronica and Paul seeking signals from local collared mountain lions.
Despite the existence of cougar source colonies in regions with road-densities comparable to the Adirondacks, regions John identified like southwest Florida’s Big Cypress Swamp and the South Dakota Black Hills, road-density is persistently raised by eastern biologists as a limiting factor on the potential for sustaining predator populations in the East. Paul, who was raised southeast of the Adirondacks in Schenectady, NY, tells me that about 70 adult mountain lions live in the peninsula triangle between San Francisco, San Jose and Santa Cruz. It’s not ideal habitat, development eats away at the open spaces, and several cats have been taken out for taking the odd, unprotected, hobby livestock. The Santa Cruz mountain lions have a lower life-expectancy than those Paul worked with on Rob Wielgus’s pioneering sport hunting research in Washington State. But the population, faced with the stresses of suburban coexistence, isn’t anywhere near threatened.

If the road-density and development around CA Rt. 17 reminds me of anything home in New York State, it’s not Rt. 73 between Keene Valley and Lake Placid in the Adirondacks, or even Rt. 28 through the Catskills. Rt. 17 reminds me — nearly identically — of Rt. 17 way down-state, the four-lane that drains north Jersey, coursing through the NYC suburbs of Rockland County northwest into Orange County, traversing the open space corridor of the Hudson Highlands, where the ‘burbs end abruptly and Sterling Forest, Harriman and Bear Mountain State Parks begin. Dreamland.

We arrive on the east side of the Santa Cruz to monitor a female and her litter of kittens in the hills above Los Gatos (Spanish for, no kidding, the cats). Her home-range is contained by an open space preserve and county park abutting abruptly the residential, southwest corner of Silicon Valley. As we rise slowly on dusty fire roads into the hills, past mountain bikers and runners and lounging retirees, downtown San Jose — home to nearly 1 million — emerges less than ten miles distant.

Paul, then Veronica, try locating the mother’s position with a hand-held antenna unsuccessfully from several locations. I ask, and Veronica tells me about her research studying oak seedlings, sure enough, becoming saplings from pumas shepherding deer around the Santa Cruz. Understory regeneration is virtually absent in our white-tail bursting, de-fanged forests back East.

Derelict houses just downhill from the kittens.
We head into town for coffee, where signals from the mother’s radio-collar should be stronger. Paul pops open his laptop, Veronica warns me about the omnipresent, nasty hazard of poison oak, before I get in line for this trip’s new indulgence, a breve latte (why did I never think to steam cream?). Suddenly, after two weeks, the female’s GPS positions start downloading, triangles of coordinates revealing that she’s been at the far end of her home-range, and away from her den, for a week. Not a good sign. Paul and Veronica decide to check the den.

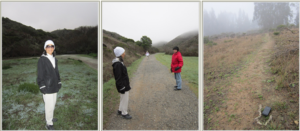
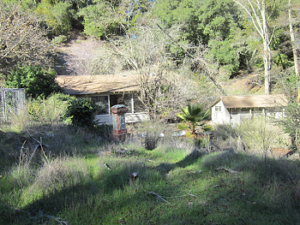
Back out on the edge of town, opening and closing access gates, a quarter-mile from a residential development, a hundred yards from the recreation-fire road, under nothing more than dense cover (and, yeah, poison oak), we find the den.

The kittens are dead. They’re gathered up for a necropsy. Nope, life ain’t easy along the suburban margins, but persistent breeding remains a sign of sustainable mountain lion habitat an arrow-shot from the 33rd wealthiest municipality in the United States.

During the rest of my vacation, I track posted mountain lion habitat along the edges and hills of the Bay, from the cattle, elk and deer-dappled coastline — and what a coastline — of Point Reyes (the rangers tell me, as Paul and Veronica did, that there is no problem with puma cattle predation), to the skyline green-belts above Berkeley and Oakland, where thousands every day recreate along Grizzly Peak Boulevard in Tilden and Redwood Regional Parks.

Landscape Without Fear: Fathers with toddlers and lap-dog walkers in Redwood Park above Oakland.

With uncle Dave and aunt Martha, my brother, Pete, and his girlfriend, Dori, we go for a hike half-way down the peninsula in the redwood glades of Butano State Park. About an hour up-creek, Dori, who once led wildlife watching tours of Alaskan brown bears on Admiralty Island, spots a hefty mountain lion turd.

LEFT: Butano State Park Advisory. CENTER: Unfraidy Cats hike in Pumaland. RIGHT: The Turd

Get the picture? From the relatively remote Grasslands-meet-the-Sea cattle ranches at Point Reyes, to the very edges of urban Oakland and San Francisco, to the trophy-home hills above Silicon Valley (see the Puma Project’s tracker maps) people and mountain lions share habitat all day, every day.

After a generation since mountain lion hunting was twice-banned by voter referendum in California, a generation in which the residents of the Golden Gate have been recreating foot to paw with cougars, there has not been a single incident in the Bay Region between a person and the big cats. While there are state protocols for dealing with cougars temporarily stuck or treed in residential areas, there’s no policy of treating a cat who enters town boundaries — as we see in the Dakotas and Nebraska — like marauding invaderswith automatic, lethal force. No one I talk to appears to feel besieged, as we hear in accounts and testimony from residents of the Prairie States — despite the best education efforts by state biologists like Nebraska’s Sam Wilson — and who live with a fraction of the cats in far emptier landscapes. The boundary between civilization and wilderness has dissolved.

Mountain lions are using nearly every last bit of unfragmented habitat in the San Francisco Bay Region. Wilderness imagined as the definition of where the big predators are, on any given day, could be your backyard. Mountain lions are neighbors.

There is no fantasy of cougar habitat restricted by road-densities, as imagined for the mighty Adirondacks. No management plan that imagines cougars must stay in “suitable habitat” determined by game agencies for cougars, or that sport hunting is a best-practice control. No fantasy between suitable public space habitat — a national forest, say — and unsuitable private space, like ranch lands. Why?

Because the brave and generous citizens of California were the first to grant Puma concolor the freedom to teach humans the limits of their habitat, to determine how close mountain lions wish to live near us, to let them be neighbors:

On Cesar Chavez Street, deep in the urban wilds of San Francisco (named, of course, for Francis of Assisi, the patron saint of animals), there is facing the street a mural painted on a wall of the Leonard R. Flynn Elementary School. The word NATIVE is embedded in the California landscape, from the Sierras to the Pacific, and anointed with the critters of the state, from eagles to seals, from turtles to herons. Front and center, reclines the puma:

Leonard R. Flynn Elementary School, Cesar Chavez Street, San Francisco.

Turns out the big critters, too, will creep in close to listen, when we let them. After all, are all the critters not citizens of this great nation?

From the city of Saint Francis, and the state of neighborly mountain lions, it sure feels like Freedom.

Christopher Spatz

Special thanks to the Puma Project’s Chris Wilmers, Paul Houghtaling and Veronica Yovovich for letting me tag along.


Smoke Bomb & Backhoe Cougar Management

Smoke Bomb & Backhoe Cougar Management

Guest Commentary by Christopher Spatz, President of the Cougar Rewilding Foundation

Cougar Rewilding Foundation President Christopher Spatz discusses recent cougar news in the Midwest. South Dakota continues to be the poster child for intolerance of dispersing lions, going above and beyond to kill any cat unfortunate enough to find itself near a populated area. Though deer are significantly more dangerous to people than predators, lions and other carnivores remain the targets for removal. On the bright side, legislators and activists in both Nebraska and Massachusetts are stepping up to try to give recolonizing mountain lions protection under state law.


Wall, South Dakota. If you’ve driven I-90 anywhere between Billings, Montana and Minnesota, you’ve seen the billboards for Wall Drug, a Main Street marketing phenomenon featuring a prairie art museum, shops and restaurants, and the eponymous drugstore. Once described by its founding pharmacist as “the middle of nowhere,” Wall Drug draws 2 million visitors a year to the town of 766 and its 2.2 square miles high on the prairie surrounded by nothing but the spectral, Crazy Horse-haunted Badlands. On December 12th, a dispersing tom likely traversing the adjacent Cheyenne River corridor was spotted within the Wall “city limits,” a move marking him under South Dakota Game, Fish & Parks (SDGF&P) guidelines for immediate execution.

The cat disappeared into a hole. SDGF&P officers dispatched to the scene began dropping smoke bombs into the cat’s temporary shelter. He didn’t flush. The town employee who first sighted him arrived with a backhoe and began excavating. As the cowering cat, “very much alive,” was uncovered, SDGF&P officers shot him. He was 2 years-old and weighed 91 lbs.

Here’s what we know about cougars temporarily treed or pinned-down in residential areas and their risk to the public: Not one has ever attacked a resident or a first-responder. Ever.

They aren’t in fight-defense mode. They want out. Running or treeing are their instinctive routes to safety. California, where 38 million people are coexisting with 5,000 cougars, enacted Senate Bill 132 authorizing the California Department of Fish & Wildlife to “use only nonlethal procedures when responding to reports of mountain lions near residences that do not involve an immanent threat to human life.” California defines “immanent threat to public health or safety” as, “a situation where a mountain lion exhibits one or more aggressive behaviors directed toward a person that is not reasonably believed to be due to the presence of responders.”

Photo of MLF Associate Director Lynn Cullens with 265 AB 2657 support letters.
Even after a miss with the first tranquilizer dart, California Department of Fish and Wildlife officers successfully sedate and relocate a mountain lion from an Altadena neighborhood in 2006. Officers ensured the safety of both the public and the lion.
Breathtaking in that language is the awareness of the cat’s potential agitation from first-responders and the accompanying hubbub: lights and sirens, the public and the media, first-responders in SWAT mode.

Killing cougars temporarily marooned within town limits are not better-safe-than-sorry situations. Decades of experience reveal otherwise, and that experience highlights the problems of perceived risk vs actual risk with respect to wildlife management and protecting the public. As noted in this Austin article about a cougar incident at Big Bend National Park, the more familiar we are with something, the less risky we perceive the threat. Let’s compare the actual human threats from cougars with those of the biggest, most familiar human killer: deer. And let’s look at South Dakota.

We’ve gone over these numbers before, but they’re worth recounting. Nationally, vehicle collisions with deer injure 30,000 and kill 150-200 people in the United States every year, causing nearly $6 billion in auto-crop-forest-residential damage, medical and mitigation costs. Deer are an acutely real multiple public threat. South Dakota ranks 4th (down from 2nd last year) in the nation in deer vehicle collisions. A 2003 study logged 4,433 deer vehicle collisions in 35 eastern South Dakota counties (66 counties in the state).

Averaging 4-6 cougar contact incidents (“attack” is a misnomer; almost all such incidents involve predation) a year in the US/Canada (the average drops even more when Canada, where Vancouver Island alone significantly pads incidents, is removed from the equation), just 3 people have been killed by cougars in the US since 1998; none since 2008. During the same 15-year period, 450,000 have been injured in the United States and 3,000 have been killed by deer. A cougar has not been implicated in a human-related incident east of the Rockies since the 1850s.

USA map showing odds of deer collision in each state.

The chance of colliding with a deer in South Dakota is 1 in 65, exceeding the risk of Mid-Atlantic states with notoriously higher deer-densities like Virginia, Pennsylvania and New York . The chance of making contact with a cougar in the western United States is 1 in 775 million; 1 in 3.4 billion for the entire country. As there have occurred no documented human-cougar incidents in South Dakota, the statistical risk is closer to 0.

Given the far greater public safety risk from vehicle collisions with deer, why does South Dakota not have a termination policy for deer encountered within city limits, as it does for cougars?

Why does no state have a comparable, zero-tolernace policy for residential deer? Real question, one I posed to SDGF&P Secretary Jeff Vonk, who replied, “. . . for the record, we do work closely with any city in SD that requests assistance to “terminate” excess deer within city limits.” Meaning every residential deer is not relentlessly hunted down with smoke bombs and backhoes — by any means available — though the public safety risk is well-documented (1 in 166 US deer collision chance on the State Farm map) and, unlike cougars, always immanent.

The young tom sacrificed in Wall would have left the city limits in a blink, but South Dakota’s open season beyond the Black Hills would have left him a marked-cat, marked, as the rash of killings that closed 2013 east of the Prairie colonies attests.


Trickle Down: Cougar Dispersal East Dropping

Dakota hunting quotas and open-season prairie hunting policies continue to limit the number of eastward dispersers measured by mortalities and captures. Before November there was just one mortality/capture, a Nebraska female accidentally killed in a cable restraint trap in January near Scottsbluff.

Photo of lion in rocky terrain, back foot caught in snare trap.
Leg-hold and snare traps set out to catch coyotes, wolves, and bobcats can nab mountain lions by mistake. If not set up properly and strictly monitored, they can be a death sentence for lions.
As we’ve seen previously, that changed dramatically later in the year as the body-count quickly climbed: a female in Burleigh County, ND on 11/8, a male in Whiteside County, IL on 11/20, a male in Souix County, IA on 12/6, a cat poached in December in the Michigan UP, the Wall cat on 12/12, and a female in Tripp County, SD on 12/14. All were shot. None were older than 2.

That’s 8 mortalities/captures for 2013, down from 9 in 2012, and 16 in 2011, the highest total since 2000. And while the number of female kills rose (another female was trapped just west of Pine Ridge, NE on 12/20), none occurred east of the Missouri River. Since 1990, a wild female cougar — dead or alive — has yet to be documented east of the Prairie States.

If there are any bright spots to emerge from the killing zone, it happened in the Midwest. The UP poachers were arrested and charged with killing a protected species. If convicted they could face up to 90 days in jail and a fine of $2500. Because none of the cats documented in the Midwest over the years have been older than 2, we have long suspected that wolves and/or poaching are taking out all of these sub-adults. However, this is the first public incident of alleged poaching.

In Illinois, a dispersing male seeking shelter under a farm corn-crib faced execution when the IL DNR Conservation officer investigating the scene consulted with the farmer.

Photo of dead lion on truck tailgate, Illinois 2013.

Cougars are not protected in Illinois, and although the cat had done nothing but traveled 800 miles looking for a girlfriend, the farmer requested that he be shot.

The incident gained the attention of the Chicago Tribune, who offered a sane and humane editorial, suggesting not only that cougars needed protection in Illinois, but wolves and black bears do as well.

Our commendation to the Tribune’s editorial board made their Voice of the People page. A piece by IL DNR director, Marc Miller, quoting former CRF intern Julia Smith’s Illinois predator habitat graduate thesis soon followed, suggesting that there is room in Illinois for apex predators.

We tapped the good vibes to offer IL DNR our Cougar Ecology and Incident Management Course for First-Responders, but after expressing interest initially, IL DNR declined. However, we’re still pursuing contacts in Illinois to schedule our next class.


Trouble With Ernie

A lone legislative voice to appear for cougar protection on the Prairies is Nebraska state senator Ernie Chambers. A 9-term legislator from Omaha who regained his seat after losing it under a term-limit provision, Nebraska’s cougar hunt was ratified during Chambers’ absence. He was re-elected in 2012 and returned with his sights set on, among other things, repealing Nebraska’s inaugural 2014, two-part hunt of 22 cougars in the panhandle’s Pine Ridge National Forest.

As the first half of the season opened January 1st and the 2-male quota was quickly reached, Chambers argued that the season should have been closed in December when a female was incidentally killed on 12/20 in a trapper’s snare near Pine Ridge. Meeting the female sub quota of 1 would effectively close either season. Chambers introduced Legislative Bill 671 (LB 671) to repeal the hunt on January 8th.

Photo of Nebraska Senator Chambers.

Dawes County Commissioner Stacey Swinney (we previously misidentified Swinney as a Nebraska Game & Parks Commissioner (NG&P); thank you to NG&P biologist Sam Wilson for setting us straight) traveled to Lincoln and met with Chambers, advocating hunting as behavior modification (both the Dakotas and Nebraska have yet to document a single cougar livestock depredation or human incident in 30 years of recolonization), “If we can make them run from us, then half the battle is won,” the kind of anachronistic management phantasy that continues to misinform anti-cougar legislation.

Robert Weilgus of Washington State University’s Large Carnivore Conservation Lab, who’s peer-reviewed research on cougar social dynamics has restructured Washington State’s cougar hunting policy (research we’ve sent to Sam Wilson and NG&P Game Commissioners), chimed in on the Nebraska hunt, suggesting that, “Hunting a population of less than 30 animals is just crazy . . . They can blink out. It’s just like rolling the dice.” The pair of males taken in January illustrates the potential for conflict Weilgus has warned of, “The bottom line, if you’re a rancher in lightly hunted population, you’re dealing with one male cougar. If you’re a rancher in a heavily hunted population . . . now you’ve got three guys you’ve got to deal with.”

Mature toms won’t tolerate younger males in their territories, gaining their maturity by avoiding pets, livestock and people. Young, marauding males will find and kill their hunted competitor’s kittens, which can push females with litters into residential areas seeking sanctuary.

Chambers’ legislative repeal isn’t without its problems. Prior to the hunt, Nebraskans already had the right to defend themselves, their pets, livestock and property from cougars, a protection that many cougar advocates feel makes the hunt unnecessary. LB 671 would also repeal the ability to self-defend. That provision could be a deal-killer.

Chambers’ LB 671 made it all the way to Governor Heineman’s desk, but was vetoed. In his veto letter, the Governor stated, “I am concerned that LB 671 is potentially unconstitutional as it prohibits wildlife management of mountain lions through hunting.” In 2012, Nebraska amended its constitution to specify, “hunting, fishing, and harvesting of wildlife shall be a preferred means of managing and controlling wildlife.”

Frustrated but still motivated, as the 2014 legislative session came to a close, Senator Chambers vowed to return next year to try once again to protect the state’s tiny population of mountain lions. In his own words, “the war is not over.”


Southern Panther Death’s Down, For Now

Panther deaths in 2013 totaled 20, down from 2012’s record 27. 15 were road-kills, also down from 18 the previous year. 21 kitten births were documented.

A bother-sister pair of orphans raised in captivity were released successfully last year to separate areas. Released in January to the Picayune Strand Forest in Collier County, the female gave birth to a kitten in June.

Photo of YouTube thumb of Florida panther release video in 2013.
The male, however, released in April into Northwestern Palm Beach County, was re-captured early this month when his radio collar transmitted that he had stopped moving. He was found alive but lethargic, and died while being monitored at the Animal Specialty Hospital in Naples. Results from his necropsy are pending.

While this could have been a perfect opportunity outlined by the USFWS in 2012 to seed a new population north of the female-stopping Caloosahatchee River, the pair were returned to saturated panther habitat. The young male, especially, faced a precarious recovery released along territory patrolled by mature toms.

On December 11th, another panther habitat protecting lawsuit led by the Center for Biological Diversity was filed to halt a proposed 970-acre limerock and sand quarry upstream from wetland preserves, wetland flowway and through a wildlife corridor. In more than 40 years of federal listing as an endangered species, not a single development proposal in panther habitat has been stopped.


Carnivore Conservation Act

Eastern coyote researcher and author, Jonathan Way, and Justice for Wolves’, Louise Kane, have gotten the jump on what many besieged predator advocates have been considering through this Dark Age of predator policy decisions: A Carnivore Conservation Act that would do for carnivores what the Migratory Bird Act did for raptor protection and recovery. In particular, the Act amends abuses and contradictions to existing carnivore hunting regulations built on the North American Wildlife Conservation Model.

First proposed for Massachusetts in March, 2013, Way and Kane’s Act will:

  1. Promote the welfare of carnivores by prohibiting cruel and inhumane hunting practices. This includes: Prohibiting penning of wildlife for purposes of training dogs or as spectator sport; Prohibiting hounding (i.e., using dogs to chase) carnivores; Extending the provisions of the MA anti cruelty laws to wild carnivores.
  2. Promote a fair-chase hunting ethic of carnivores. This includes:Prohibiting baiting for purpose of killing carnivores; Prohibiting shooting carnivores from inside a home or building; Prohibiting night hunting; Prohibiting the use of electronic calls.
  3. Require scientifically valid carnivore management practices that serve a legitimate management purpose/objective/goal. This includes:Prohibiting wildlife killing contests or predator derbies; Creating a quota for carnivores; Requiring the purchase of a carnivore hunting tag and creation of a minimum fee for hunting carnivores; Reduce season hunting lengths; Establishing no hunting refuges on state and federal park and forest lands; Mandating training for wildlife specialists that “remove” carnivores for management purposes; Requiring good animal husbandry practices to prevent carnivore livestock conflicts; Creating a wanton waste provision for carnivores similar to other game species.
  4. Require the use of current and best available science in wildlife management decisions of carnivores. This involves abandoning principles that support the maximum utilization or killing of carnivores and requires accounting for the ecological importance of carnivores in fully functioning and robust ecosystems and recognizing their innate social and family structures.This includes: Obtaining scientific research permits without political interference; Recognizing and identifying eastern coyotes also as “coywolves” (Canis latrans x C. lycaon) in order to recognize their mixed species (western coyote x eastern wolf) background; Creating a carnivore conservation biologist position to focus on non-lethal management objectives for carnivores and to study and promote tolerance of carnivores.
Photo of coyote in snow.Way and Kane hope to take the Carnivore Conservation Act national.


Here, here!


Christopher Spatz


Cougar mortality statistics provided by Helen McGinnis. Cougar incident statistics provided by John Laundré